XRP - long term EW-Analysis
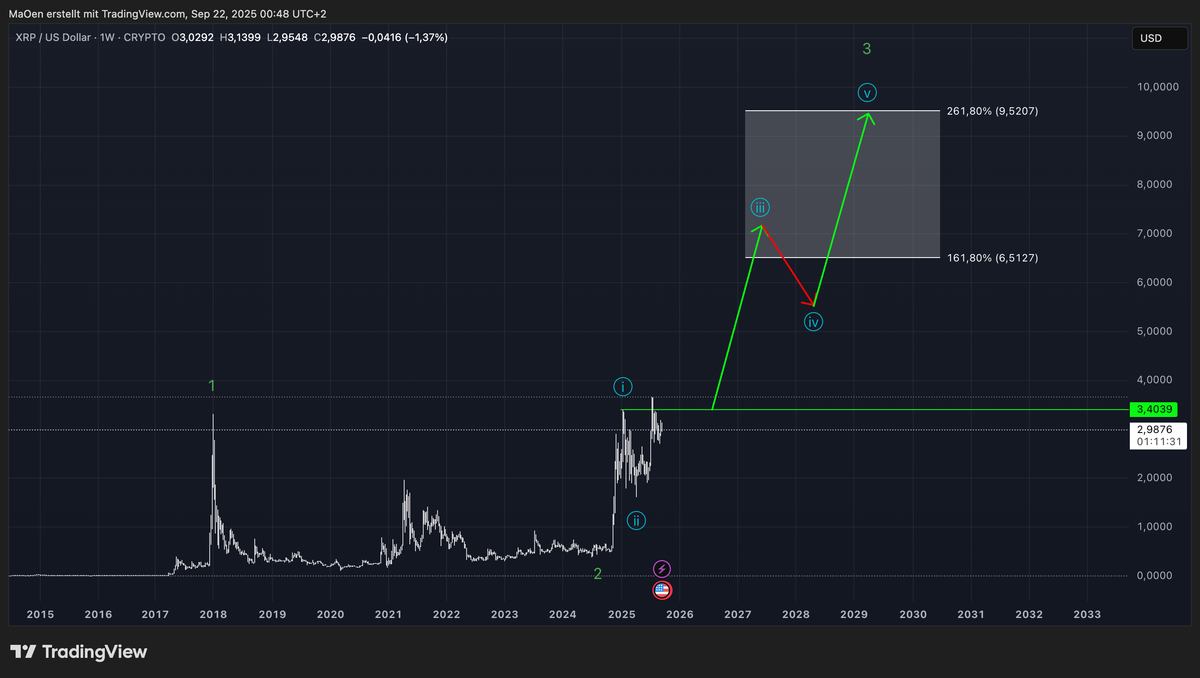
This chart represents our primary long term expectations for XRP.
In 2018, XRP established its all-time high, which we identify as green wave 1. This was followed by green wave 2, which successfully completed at the end of 2024. This long-term 1,2 foundation in green forms the structural basis of our current analysis.
After finishing wave 2 in green, XRP has begun a new impulsive sequence. We are currently tracking light blue wave 1, followed by light blue wave 2, laying the groundwork for the upcoming advance.
To project price development, we have defined a Fibonacci target zone,between the 161.8% extension at $6.51 and the 261.8% extension at $9.52. Within this zone, we expect XRP to complete its green wave 3. However, given the strong impulsive character of the lower light blue cycle, there is the potential for price action to extend even higher than our initial projections.
Trading Plan:
We recommend patience until price decisively breaks above the neon green confirmation level, which would validate our wave count. In our mid- to short-term analysis, we will provide more detailed insights, including potential new buying opportunities.
This outlook reflects our primary expectation for XRP`s long-term performance. Always ensure that you review our long-term projections first before moving on to our mid- and short-term Elliott Wave analyses.