Solana Long-Term EW-Analysis
This chart represents our primary long term expectations for Solana.
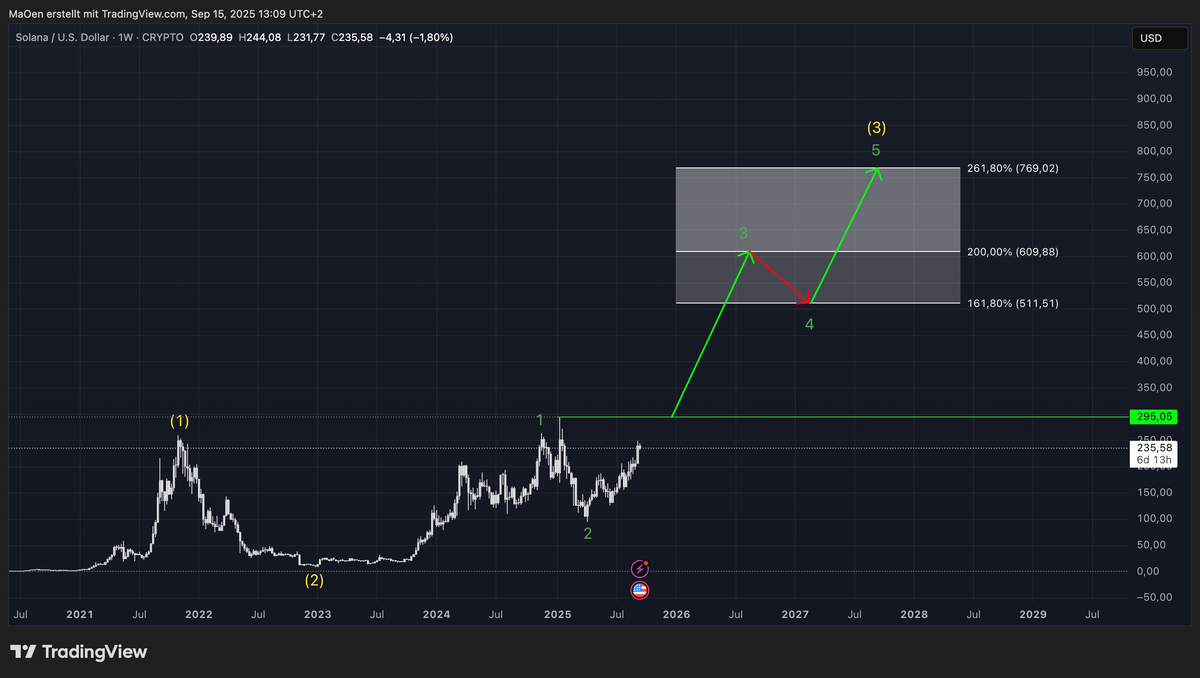
The initial 1–2 structure in yellow forms the foundation of our analysis and signals the beginning of a larger impulsive cycle. This setup suggests that Solana has already completed a bullish 1–2 sequence and is now preparing to extend into wave 3 in yellow.
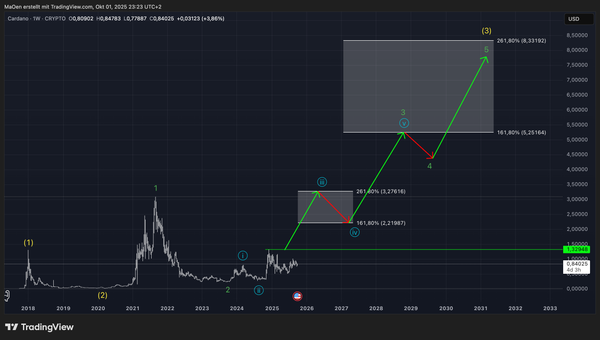
Within this larger degree, the 1–2 structure in green highlights the lower-degree cycle that is constructing wave 3 (yellow). This internal sequence is expected to unfold through a strong and impulsive wave 3 in green, followed by a corrective wave 4, and ultimately a final wave 5 in green. Upon completion, this five-wave advance should terminate within the projected Fibonacci target zone.
The Fibonacci target zone represents our primary expectation for Solana’s price development, spanning from the 161.8% extension at 511 USD up to the 261.8% extension at 769 USD.
Trading Plan:
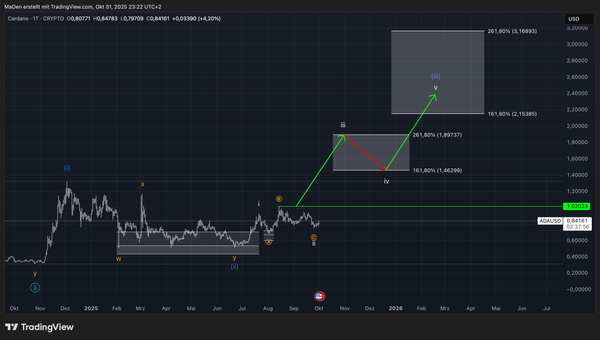
Our mid- to short-term analysis highlights attractive buying opportunities. The chart details a bullish scenario in which Solana has already initiated the impulsive wave 3 in green, setting the stage for further upside toward the Fibonacci target range. We recommend to combine our long term analysis with the mid to short-term.
This outlook reflects our primary expectation for Solanas long-term performance. Always ensure that you review our long-term projections first before moving on to our mid- and short-term Elliott Wave analyses.