S&P 500
The S&P 500 is currently advancing through the final stage of its long-term impulsive cycle.
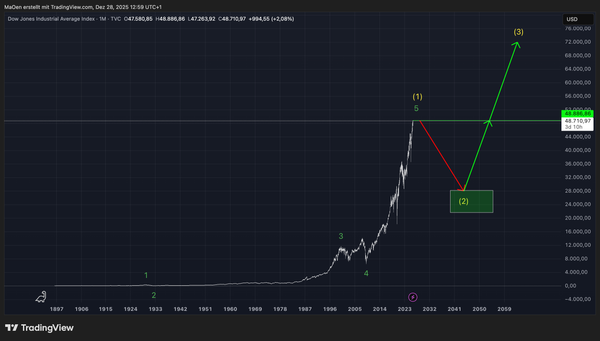
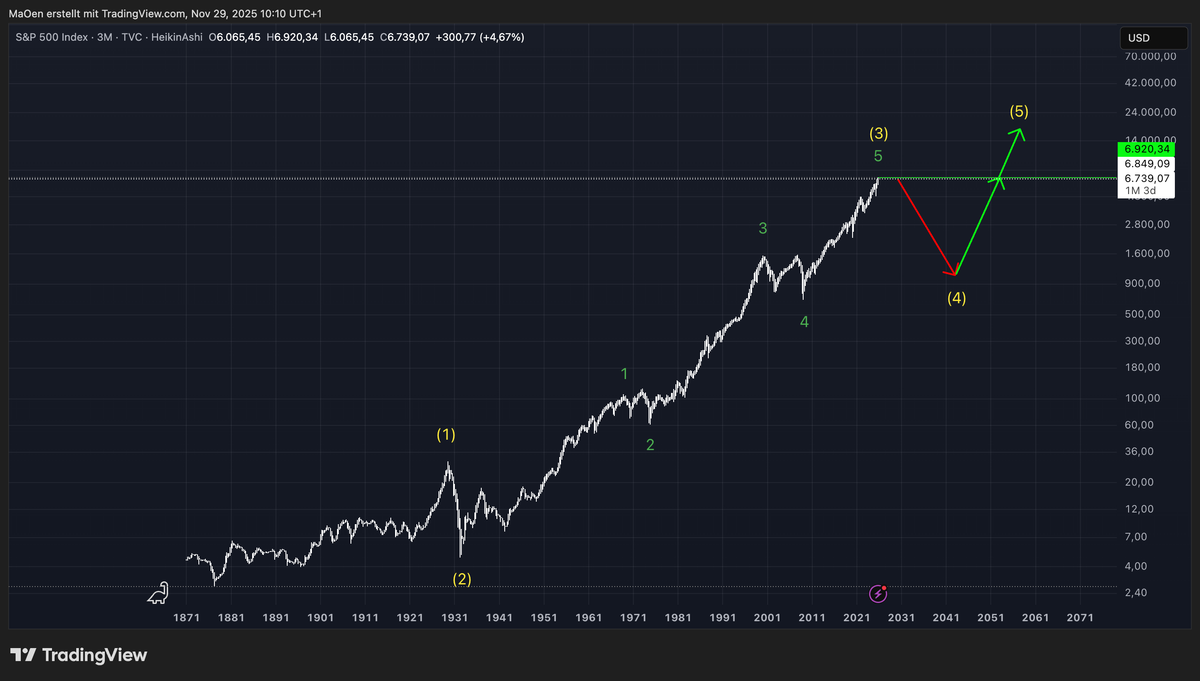
Since August 1877, the index began forming its first large-scale impulsive structure, establishing an initial 1–2 setup that defined the foundation of the yellow Wave 1 and Wave 2. This early configuration set the structural groundwork for the decades that followed.
After the completion of yellow Wave 2 in 1932, the S&P 500 initiated its first major impulsive advance within yellow Wave 3, expressed through the unfolding green cycle. This powerful, multi-decade impulse has been driving price development ever since.
At present, the S&P 500 appears to be moving through the terminal phase of yellow Wave 3, approaching the final stages of this long-term wave.
From a long-range perspective, once yellow Wave 3 is fully completed, we expect the index to transition into a broader corrective phase forming yellow Wave 4. After this correction, the market should resume its structural bullish trajectory, launching a new long-term impulsive advance into yellow Wave 5, which will ultimately complete the entire yellow-degree cycle.
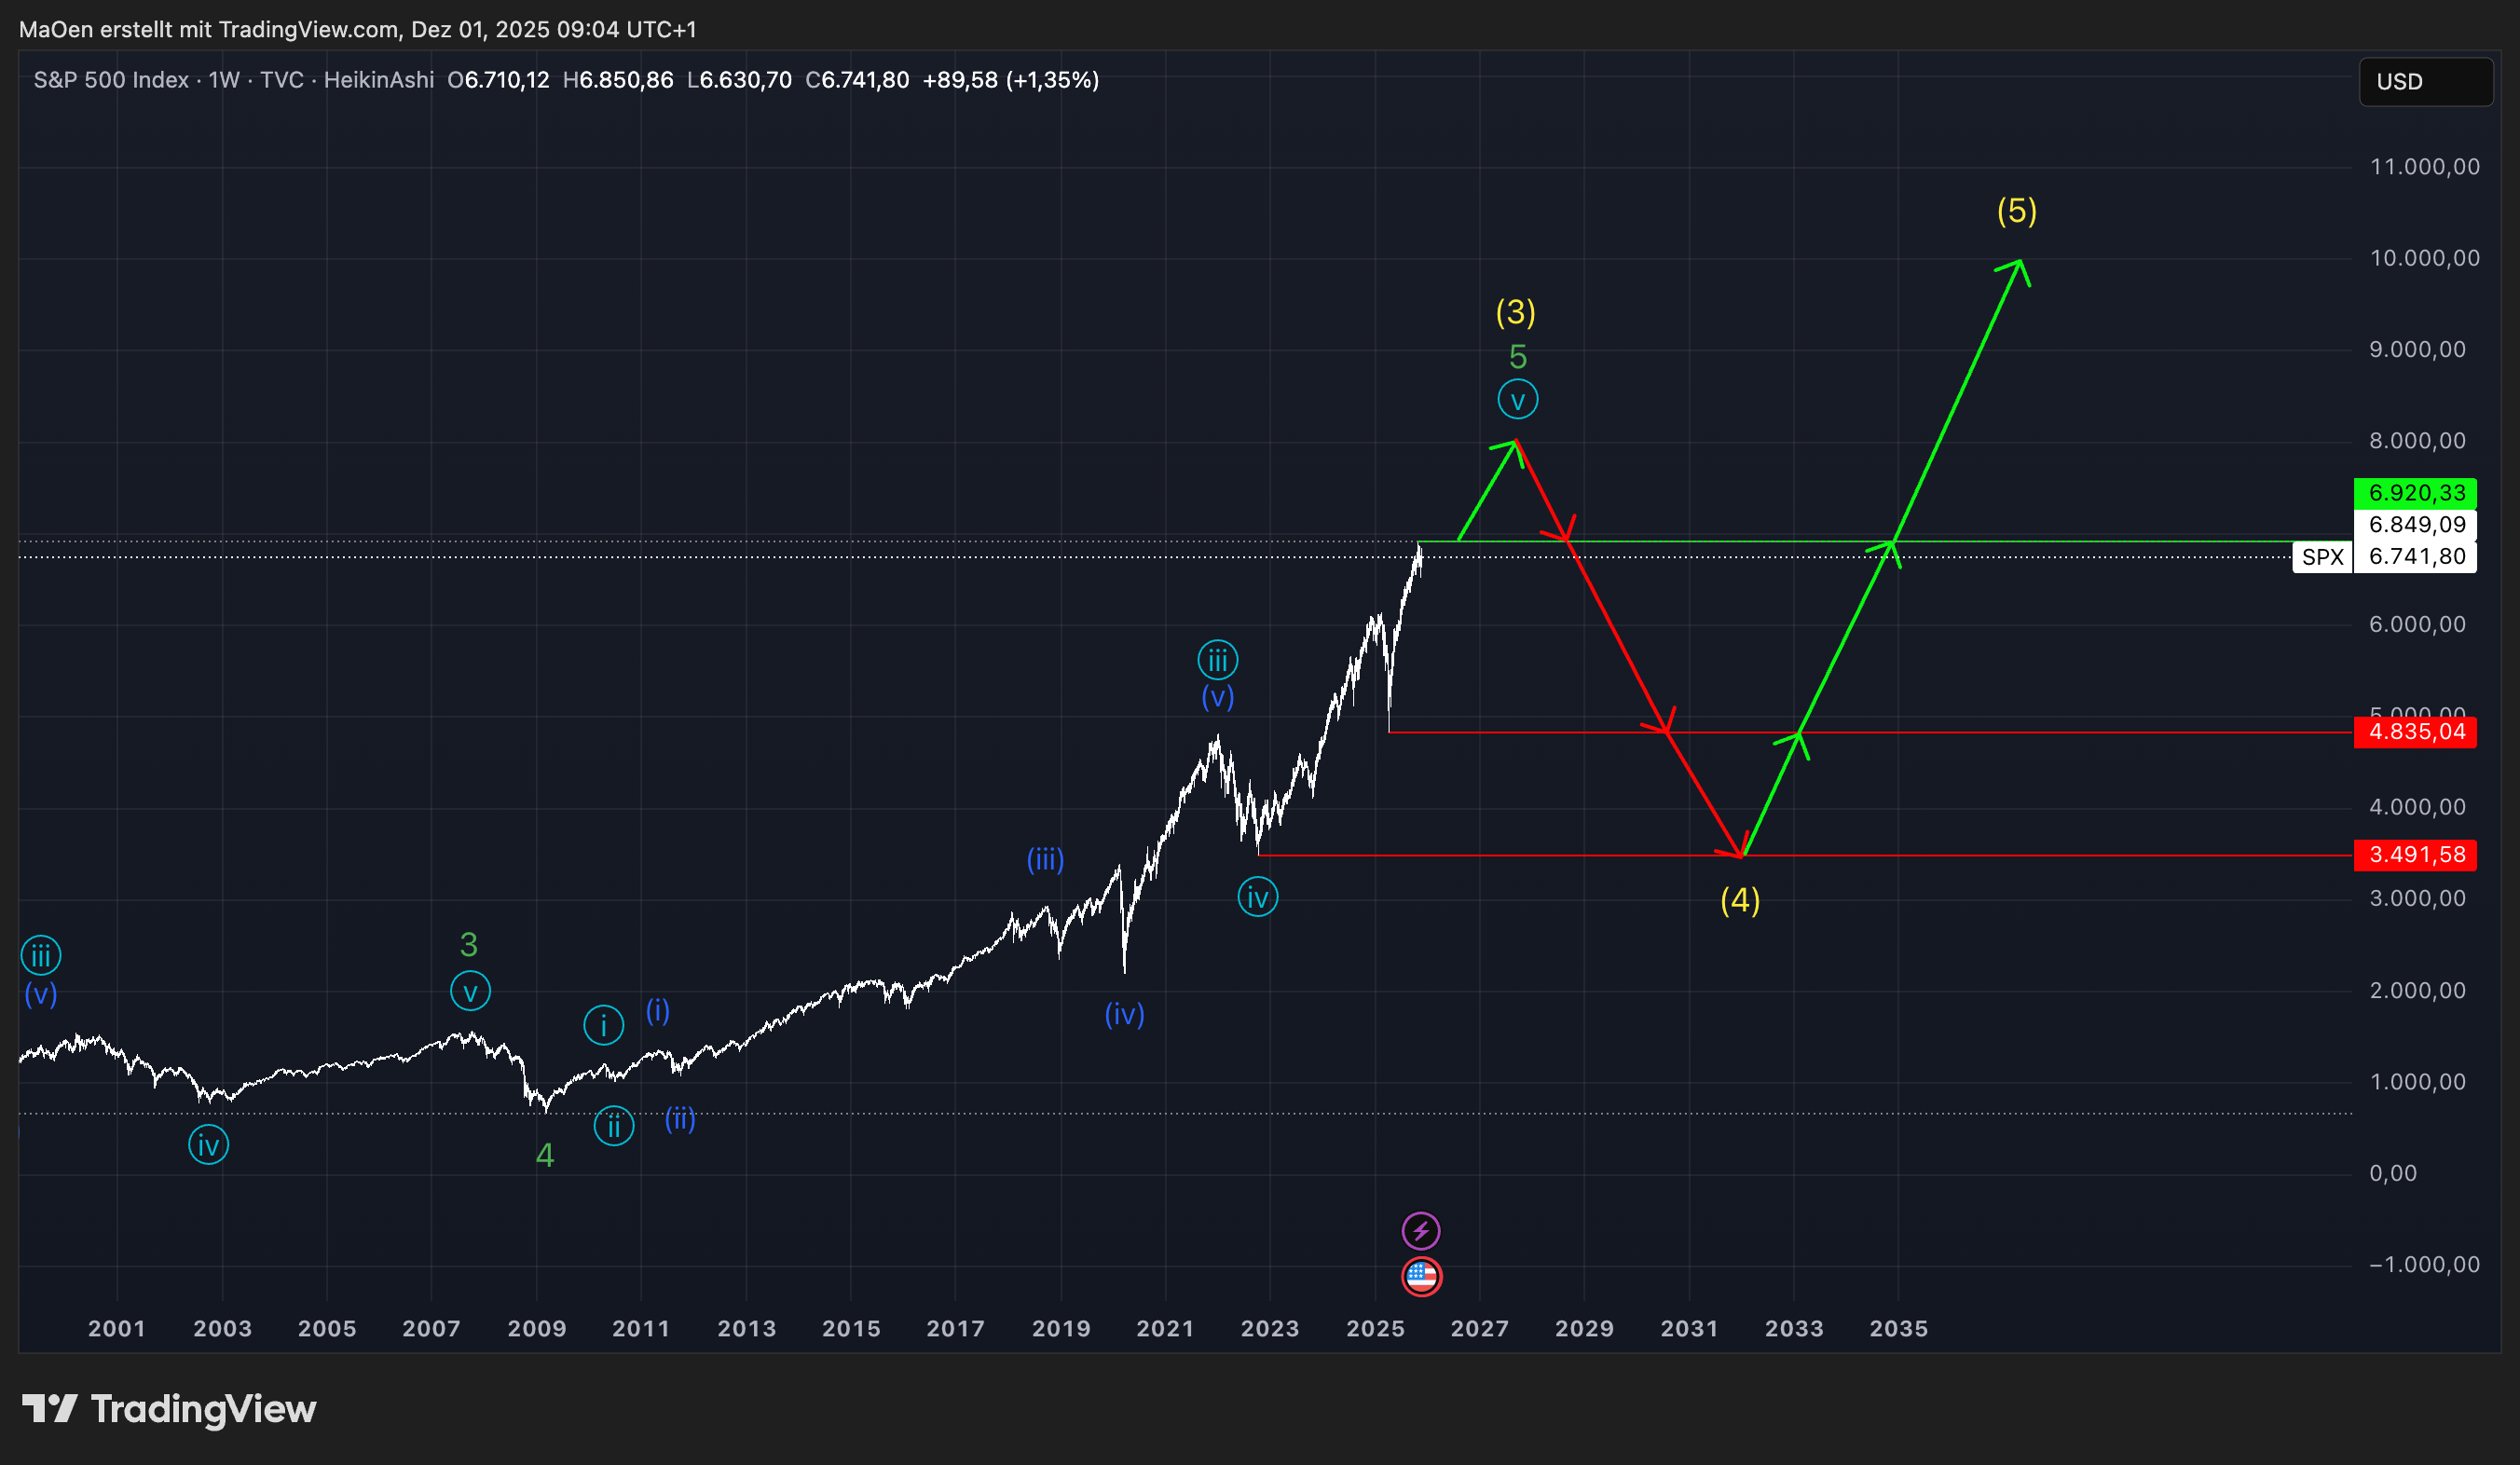
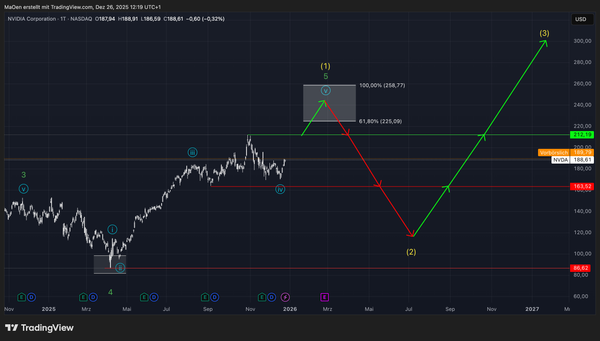
When we shift our focus to the weekly chart, a more detailed wave count emerges for the final stage of our long-term expectation for the S&P 500. We anticipate the index to establish a new major high, breaking above its current all-time high at 6,920.33 points. Once a new high is confirmed, we assign a high probability that light-blue Wave 5 will have reached completion. This would simultaneously complete green Wave 5, which in turn finalizes the entire impulsive advance of yellow Wave 3.
Following the completion of yellow Wave 3, we will provide a Fibonacci retracement zone in which we expect the S&P 500 to form yellow Wave 4. This corrective phase should set the foundation for the next major long-term impulsive leg into yellow Wave 5.
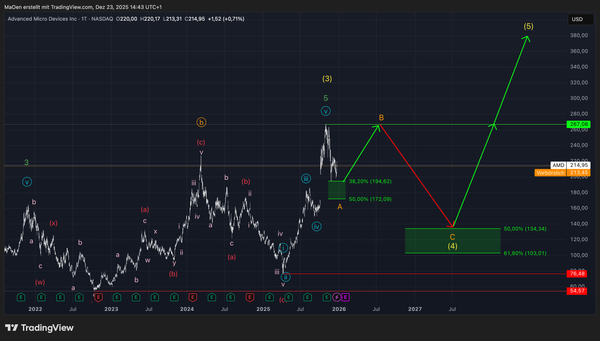
Looking at our short-term outlook, we can already identify a more precise price region in which new all-time highs are likely to occur before the index completes its final topping process.
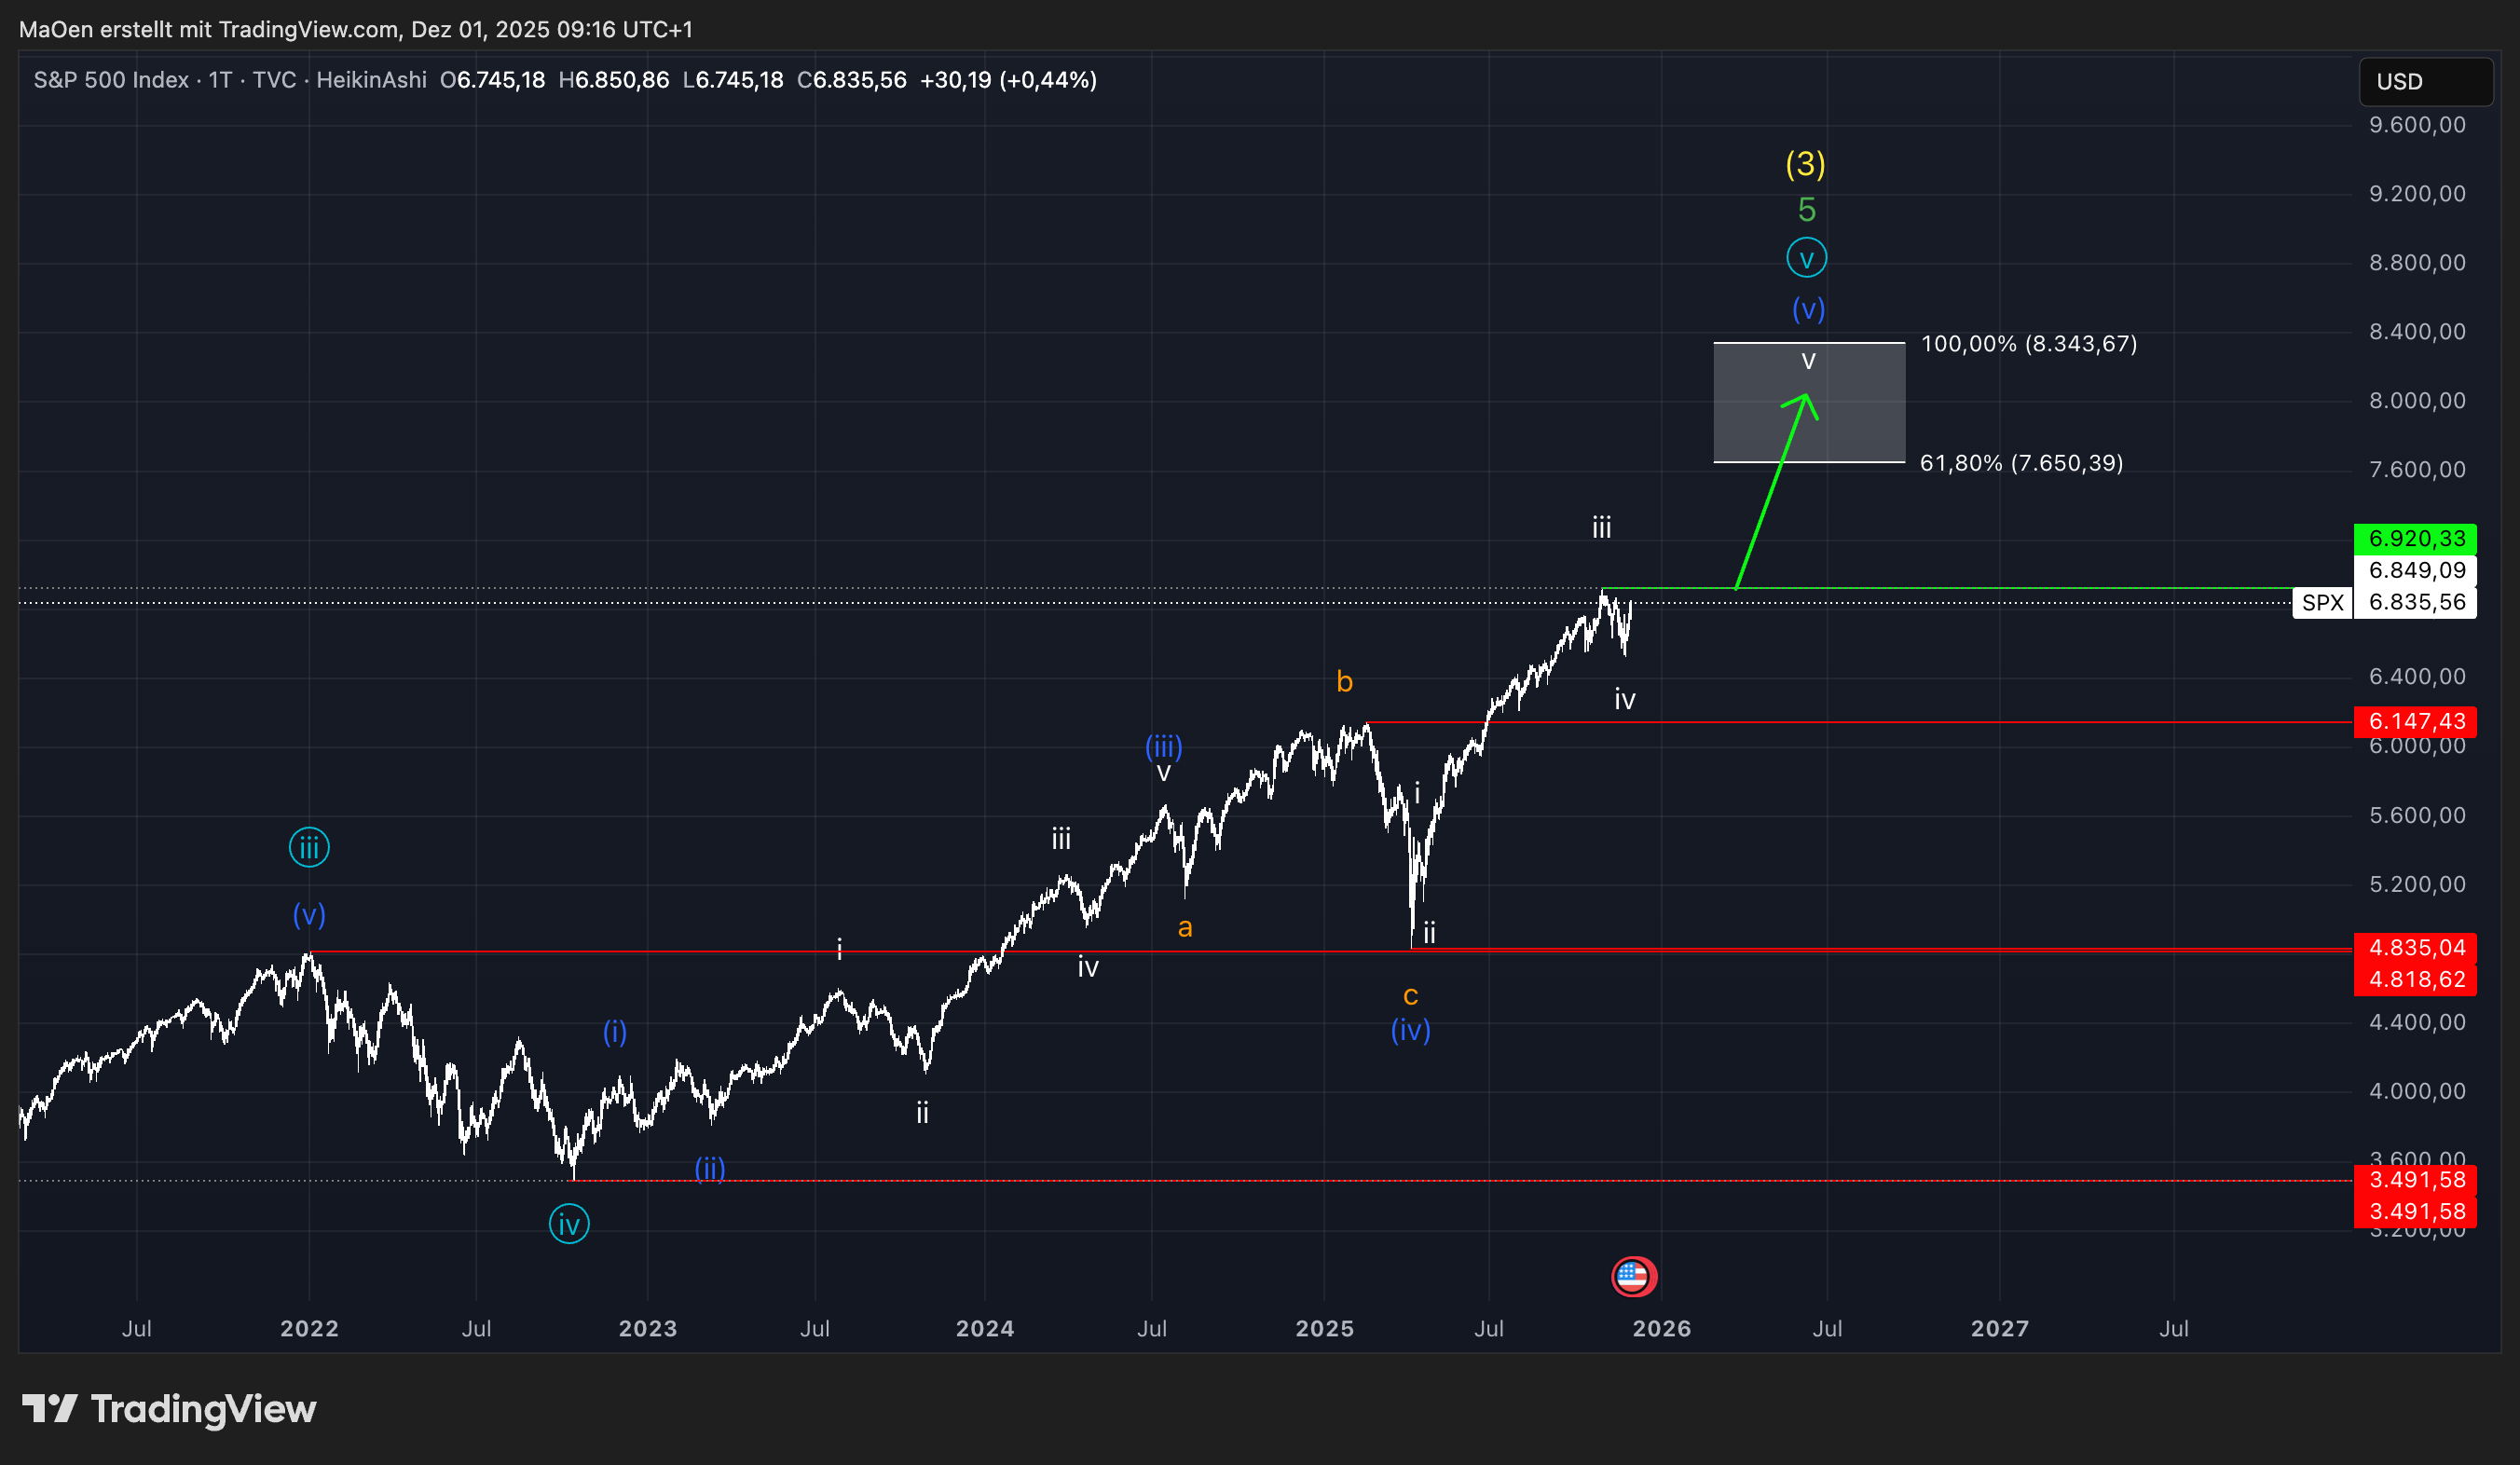
In our short-term count, we clearly anticipate the S&P 500 to establish a new high, completing white Wave 5, dark-blue Wave 5, light-blue Wave 5, green Wave 5, and ultimately yellow Wave 3.
Should the index break above its current all-time high, we expect it to advance into our projected target zone, ranging from the 61.8% extension at 7,650.39 points up to the 100% extension at 8,343.67 points.
Trading Plan:
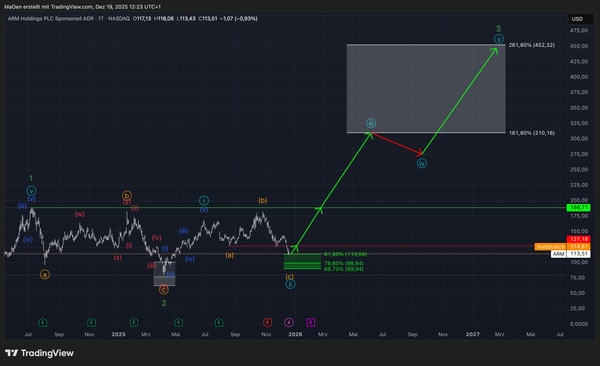
Our projected target range—where we expect the S&P 500 to form a final top, both from a long-term and short-term perspective—represents a highly favorable shorting or profit-taking zone. This outlook remains valid until the upcoming corrective phase of yellow Wave 4 has fully developed on the long-term chart.
At this stage, we maintain a bearish stance on the index.
If any structural changes emerge or the S&P 500 reaches our identified shorting/selling zone, we will provide an immediate update.
Kind regards,
Monalytics