Rheinmetall AG (RHM) EW-Analysis
Is the Rally over?
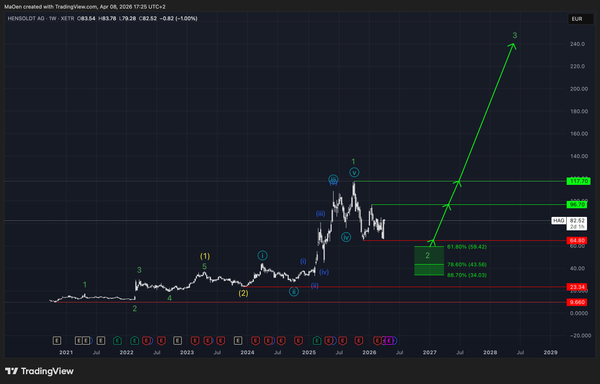
Rheinmetall has shown a strongly bullish trajectory over the past years, delivering substantial returns. Beginning in 2007, the stock developed an initial impulsive structure, forming light blue wave 1. This was followed by an extended consolidation phase, which completed light blue wave 2 in 2015.
After the completion of light blue wave 2, Rheinmetall entered an exceptionally strong rally. This move formed light blue wave 3, followed by a corrective wave 4, and ultimately the final impulsive leg into wave 5.
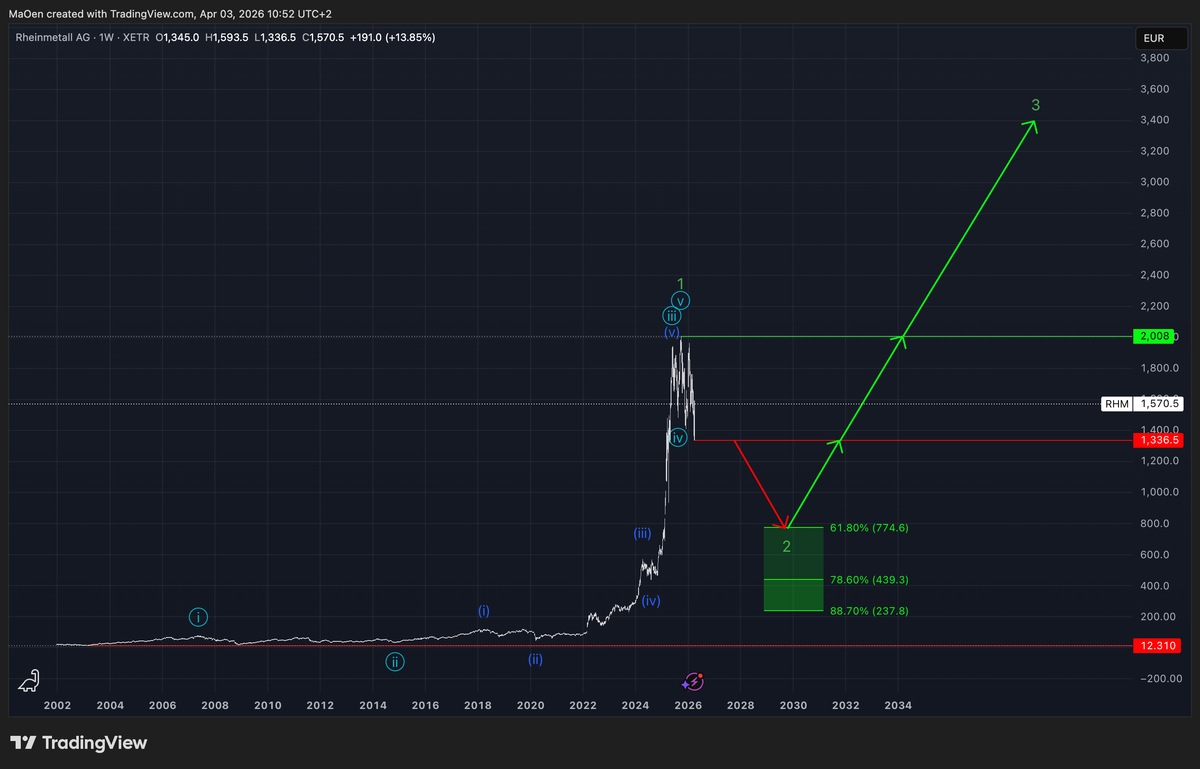
At this stage, we assume that the entire light blue cycle has been completed. This structure now represents green wave 1 of a higher-degree trend, marking the all-time high at $2,008.
Following the completion of green wave 1, the market is expected to transition into a corrective phase, forming green wave 2. From a long-term perspective, this correction should eventually provide the foundation for a renewed bullish trend, leading into green wave 3.
Currently, the market appears to have already entered this corrective phase into green wave 2. For this correction, we have identified two Fibonacci retracement zones, which we consider attractive areas for accumulation—both for short-term positioning and long-term investment opportunities.
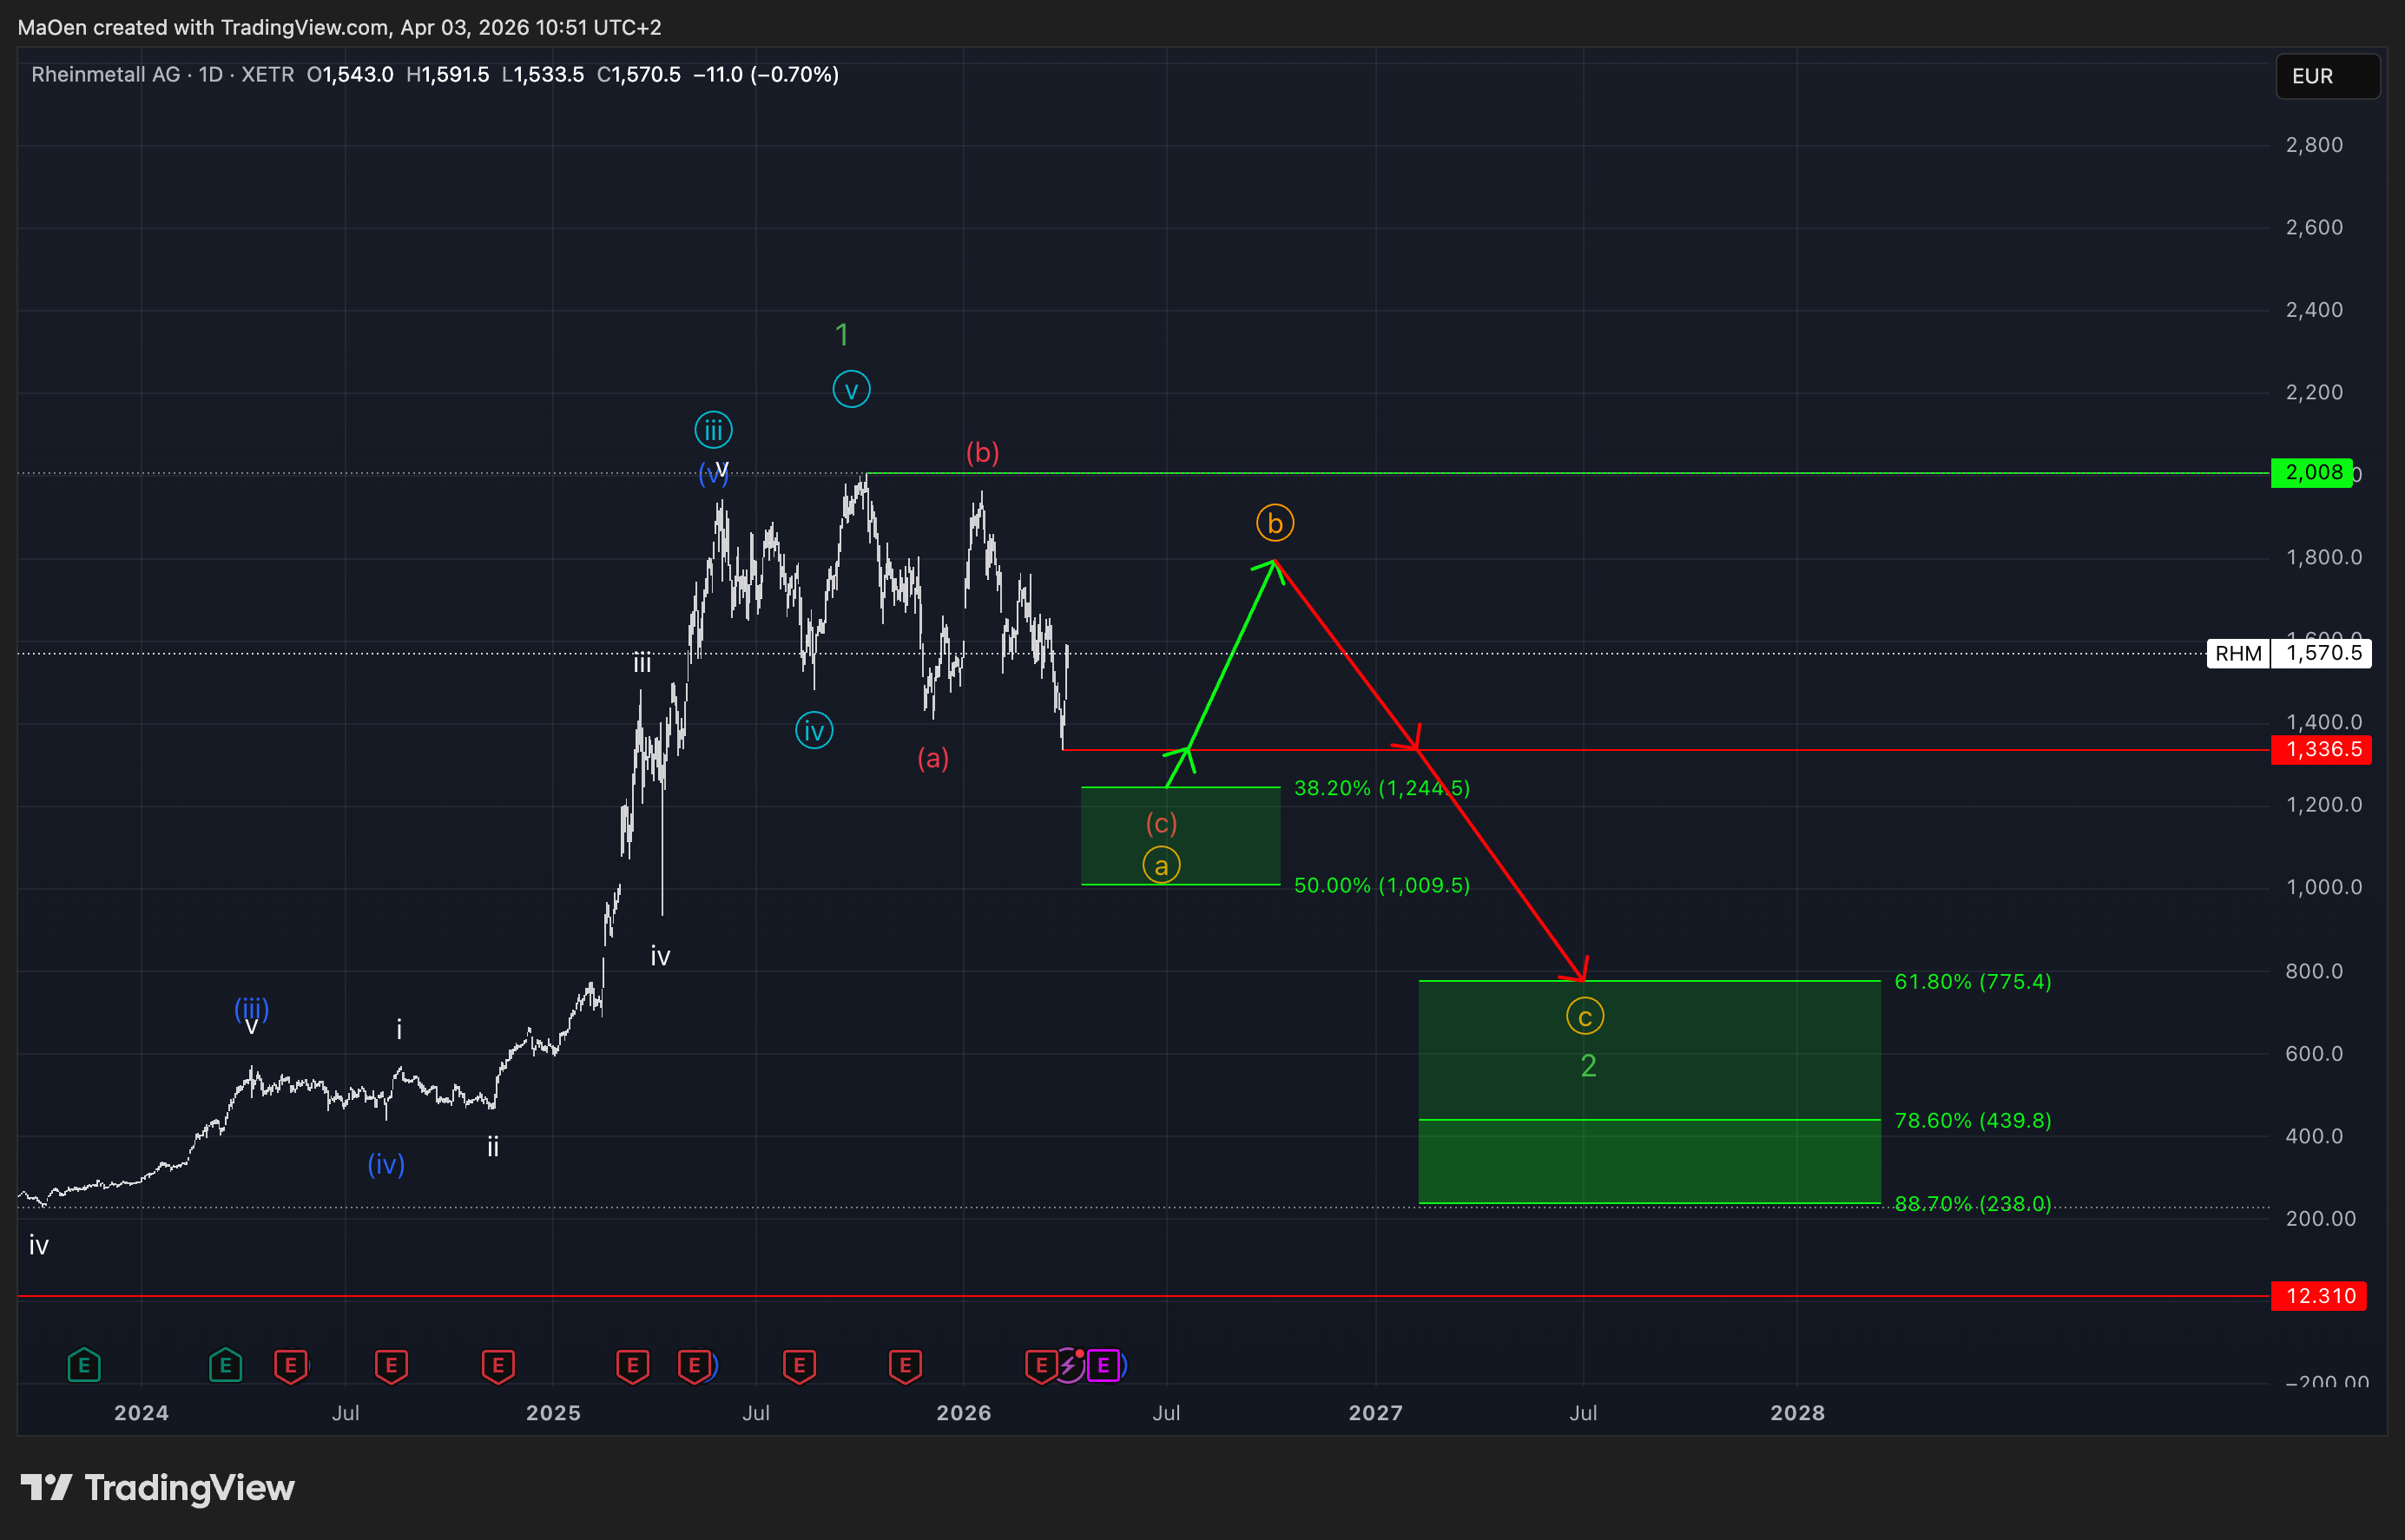
We expect this correction into green wave 2 to unfold as a typical flat structure, consisting of three waves: orange wave a, b, and c.
For orange wave a, we have defined the first Fibonacci retracement zone. This zone ranges between:
- 38.2% at $1,244
- 50.0% at $1,009
Within this area, we expect the first leg of the correction (orange wave a) to find completion.
From there, the market should regain short-term bullish momentum and enter a temporary recovery phase, forming orange wave b. Once this recovery phase is completed, we anticipate a renewed and stronger sell-off into orange wave c. This final leg should complete the overall correction and mark the end of green wave 2.
For this termination zone, we have identified a second Fibonacci retracement area, which we consider our primary long-term accumulation region. This zone is defined as:
- 61.8% at $775.4
- 78.6% at $439.8
- 88.7% at $238.0
From our perspective, this range represents highly attractive long-term buying levels. In line with our broader outlook, this could offer an opportunity to accumulate Rheinmetall at significantly discounted prices for long-term investment positioning.
That said, the market is still in the early stages of this corrective phase.
If any structural changes occur or if one of our defined zones is reached and activated, we will provide an immediate update.
Kind regards,
Monalytics
DISCLAIMER: The content on this website, including charts, analyses, and recommendations, is for informational purposes only and does not constitute financial, investment, or professional advice. Trading and investing involve risk. You should consult a qualified financial advisor before making any investment decisions.