Polkadot - Mid-short-term EW- Analysis
This chart represents Polkadot in its Mid-short term Elliot wave analysis, with our primary expectations for this market.
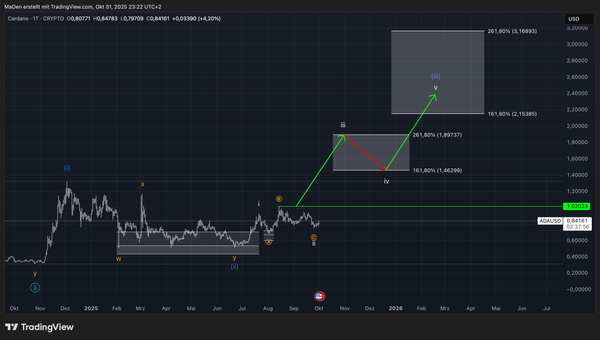
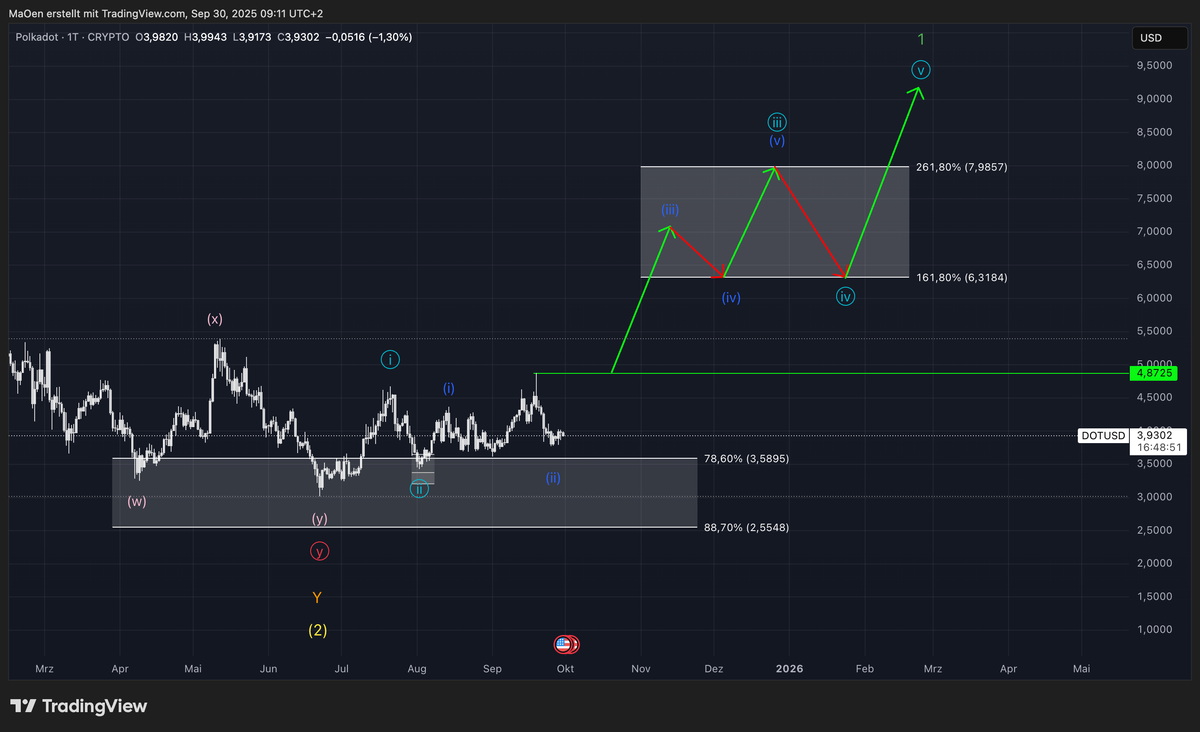
Polkadot has completed its prolonged corrective phase with yellow Wave 2, establishing a major cycle low. From this point, the market initiated a first impulse in light-blue Wave 1, followed by its corresponding corrective light-blue Wave 2. This one-two structure suggests the potential onset of a significant momentum shift.
After completing this initial light-blue one-two sequence, Polkadot developed a second one-two setup at the lower dark-blue degree, which is expected to drive the unfolding of light-blue Wave 3.
For this upcoming light-blue Wave 3, we have defined a Fibonacci extension target zone, where the advance may potentially terminate:
- 161.8% extension at 6.31 USD
- 261.8% extension at 7.98 USD
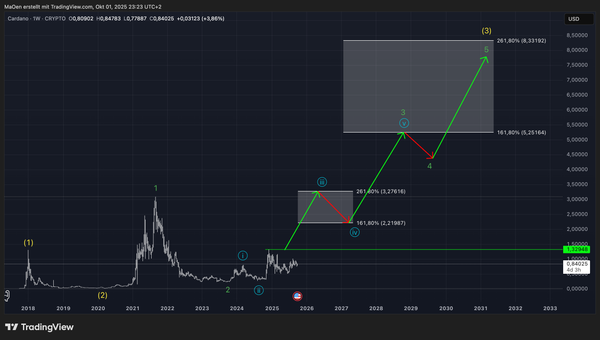
Should this wave unfold as anticipated, we expect it to be followed by a corrective light-blue Wave 4 and a final light-blue Wave 5, which together would complete green Wave 1.
This green Wave 1 belongs to a higher degree and is expected to develop as a full five-wave structure. It will serve as the foundation for the impulsive yellow Wave 3, which we have already detailed in our long-term analysis.
Trading Plan:
A confirmed break above the local resistance at 4.87 USD would validate our primary scenario, pointing toward the advance into the projected target zone.
If Polkadot fails to maintain its current structure, we must consider our bearish alternative scenario. However, at this stage, we continue to assign it a significantly lower probability than our primary bullish outlook.
Keep in mind:
This outlook reflects our primary expectation for Polkadot`s Mid to short-term performance. Always ensure that you review our long-term projections first before moving on to our mid- and short-term Elliott Wave analyses.