Hedera (HBAR) - Long Term EW-Analysis
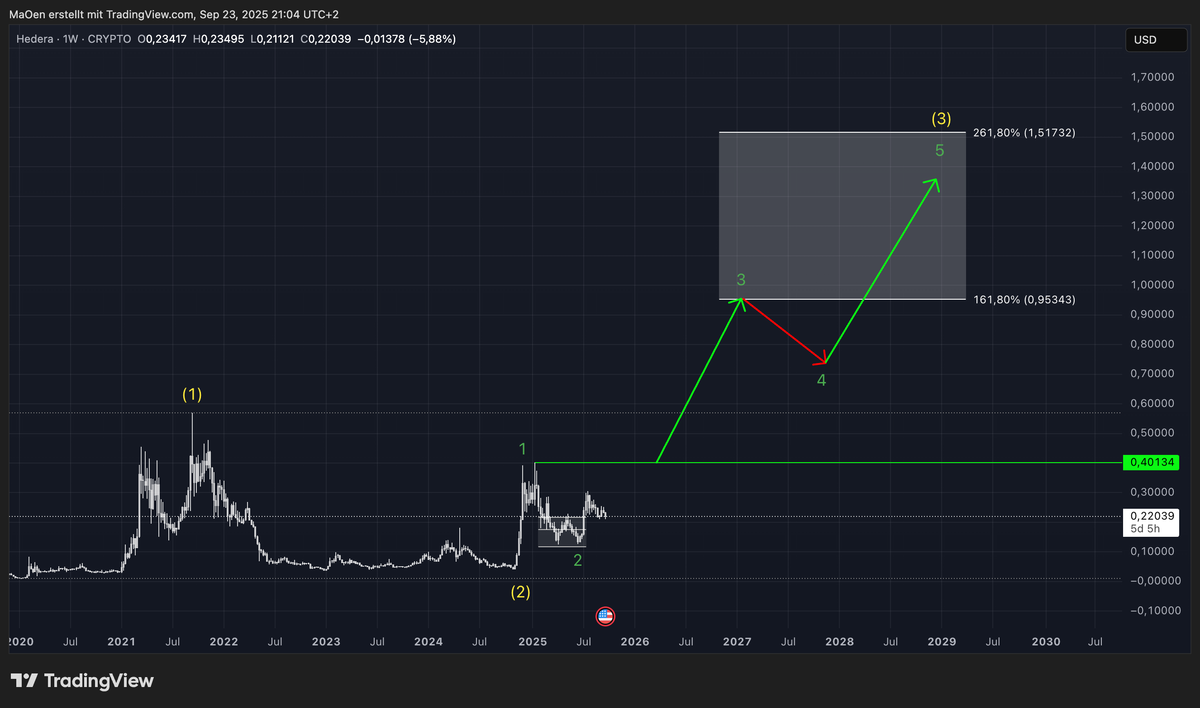
This chart represents our primary long term expectations for HBAR.
HBAR completed a clean one-two structure in yellow by the end of 2024 and subsequently initiated its first bullish impulse with green Wave 1, followed by the corrective green Wave 2. This green cycle lays the foundation for the upcoming impulsive yellow Wave 3.
In this chart, we outline our price expectations for the termination of yellow Wave 3. The Fibonacci target zone spans from the 161.8% extension at 0.95 USD up to the 261.8% extension at 1.51 USD.
Trading Plan:
The grey zone, where the green wave 2 found its end, marked a strong buy opportunity for this coin. From here, we now recommend to wait for HBAR to break above the neon-green resistance line in order to confirm our primary bullish scenario, paving the way for green Wave 3 to unfold.
In our mid- to short-term analysis, we provide more detailed insights into HBAR on lower timeframes and identify additional potential buy opportunities to align with the larger Elliott Wave outlook.
This outlook reflects our primary expectation for HBAR`s long-term performance. Always ensure that you review our long-term projections first before moving on to our mid- and short-term Elliott Wave analyses.