Ethereum Long-Term EW-Analysis
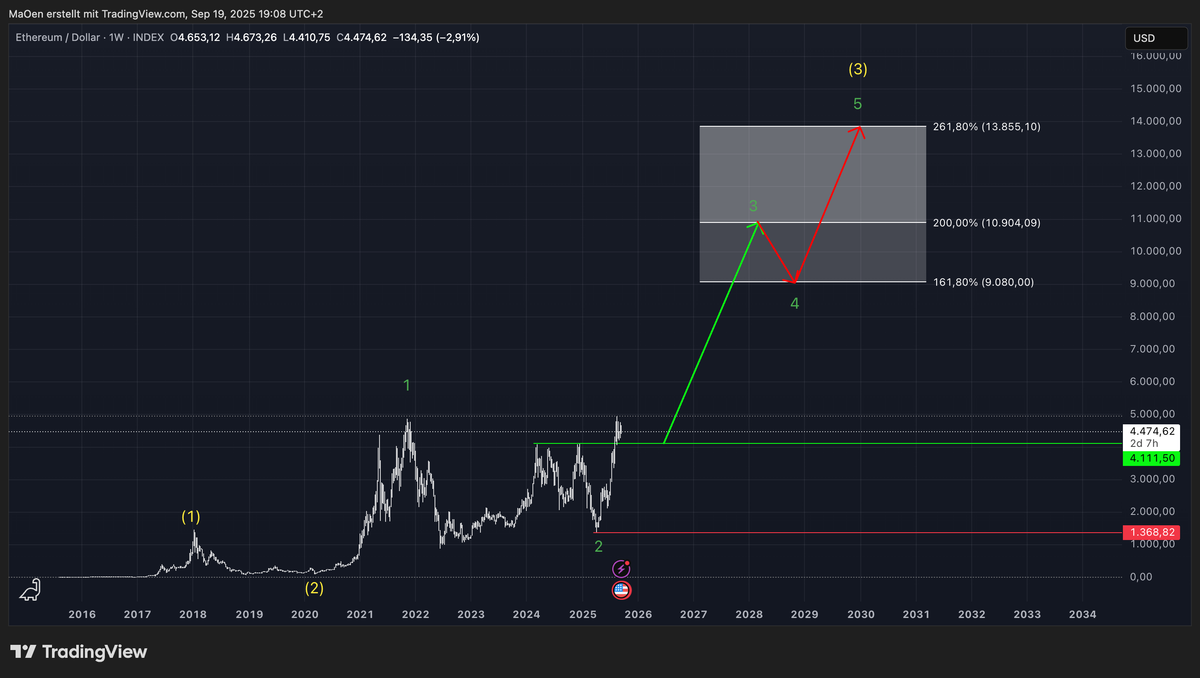
The chart illustrates our long-term outlook for Ethereum. The first 1,2 structure in yellow establishes the foundation of our analysis. Building on this, the second 1,2 structure in green represents the lower-degree cycle that unfolds into the impulsive wave 3 in yellow.
The structure remains straightforward and well-defined. The Fibonacci target zone highlighted in the chart marks our expectation for where Ethereum could complete this yellow wave 3. This zone is defined by the key Fibonacci extensions:
- 161.8% at 9k
- 261.8% at 13k
It is important to emphasize that this zone serves as a guideline: price action could underperform relative to projections, but it could also extend far beyond them in a strong bullish scenario.
Current Trading Plan
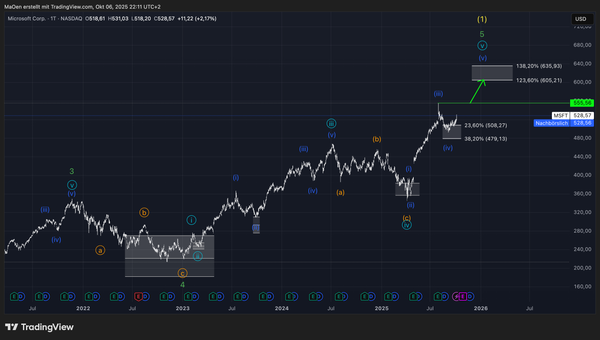
Ethereum has recently completed a bullish impulse and already established a new all-time high. In our mid-term analysis, we provide more detailed insights to identify potential long-entry opportunities for the upcoming impulsive upward movement.
This outlook reflects our primary expectation for Ethereum’s long-term performance. Always ensure that you review our long-term projections first before moving on to our mid- and short-term Elliott Wave analyses.