Dow Jones Industrial Average (DJI) - Elliot wave Analysis
Since its listing on 28 May 1896, the Dow Jones Industrial Average has become the most well-known and important stock market index. From a structural point of view, this index is an Elliott Wave icon and represents the foundation of Elliott Wave Theory. Ralph Nelson Elliott used the Dow Jones in the 1930s for his first analyses and studies and later published the Elliott Wave Theory in 1939 based largely on his work with the Dow Jones.
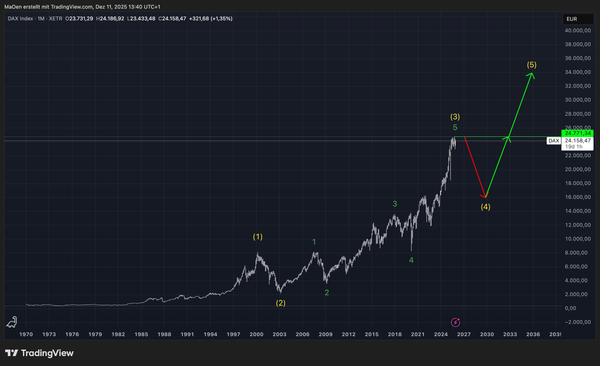
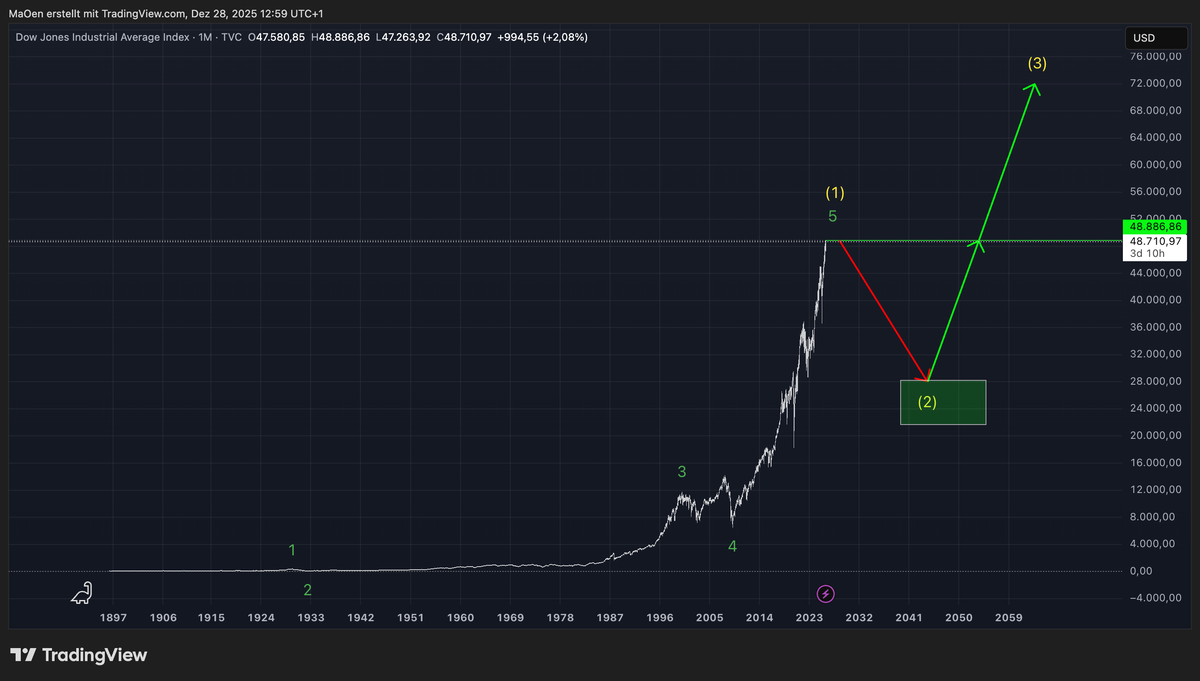
Structurally, the Dow Jones developed strong impulsive moves and began a long-term cycle that formed the basis for a historic rally, starting with the first green-degree cycle. After completing its first fractal structure with green wave 1 and green wave 2, the Dow Jones entered its first major bullish phase with a powerful green wave 3. This move was followed by an additional corrective phase in green wave 4, completing the second green-degree fractal.
Currently, the Dow Jones is trading in the final stage of the entire green cycle and is approaching the completion of green wave 5. Once green wave 5 is completed, the green cycle will end and transition into the first major sequence of the next higher-degree long-term cycle, identified as yellow wave 1.
In our long-term outlook, we expect the Dow Jones to complete the green cycle and build yellow wave 1. From there, we anticipate a major correction, which should unfold as bearish yellow wave 2 and form the first major fractal of the yellow long-term cycle.
We will provide the Fibonacci retracement zone where we expect yellow wave 2 to end. This zone can be defined once yellow wave 1 has clearly terminated and the first structural signs of a trend reversal appear. On the chart, this area is marked by the light green box. From this Fibonacci retracement zone, we expect yellow wave 2 to complete, followed by renewed strong bullish momentum.
At that point, the Dow Jones should begin new bullish impulses and start a long-term advance into yellow wave 3, supporting a potential bull market over the coming decades.
This chart represents our long-term outlook. Our short-term outlook strongly aligns with this analysis and provides a more detailed wave count on lower time frames.
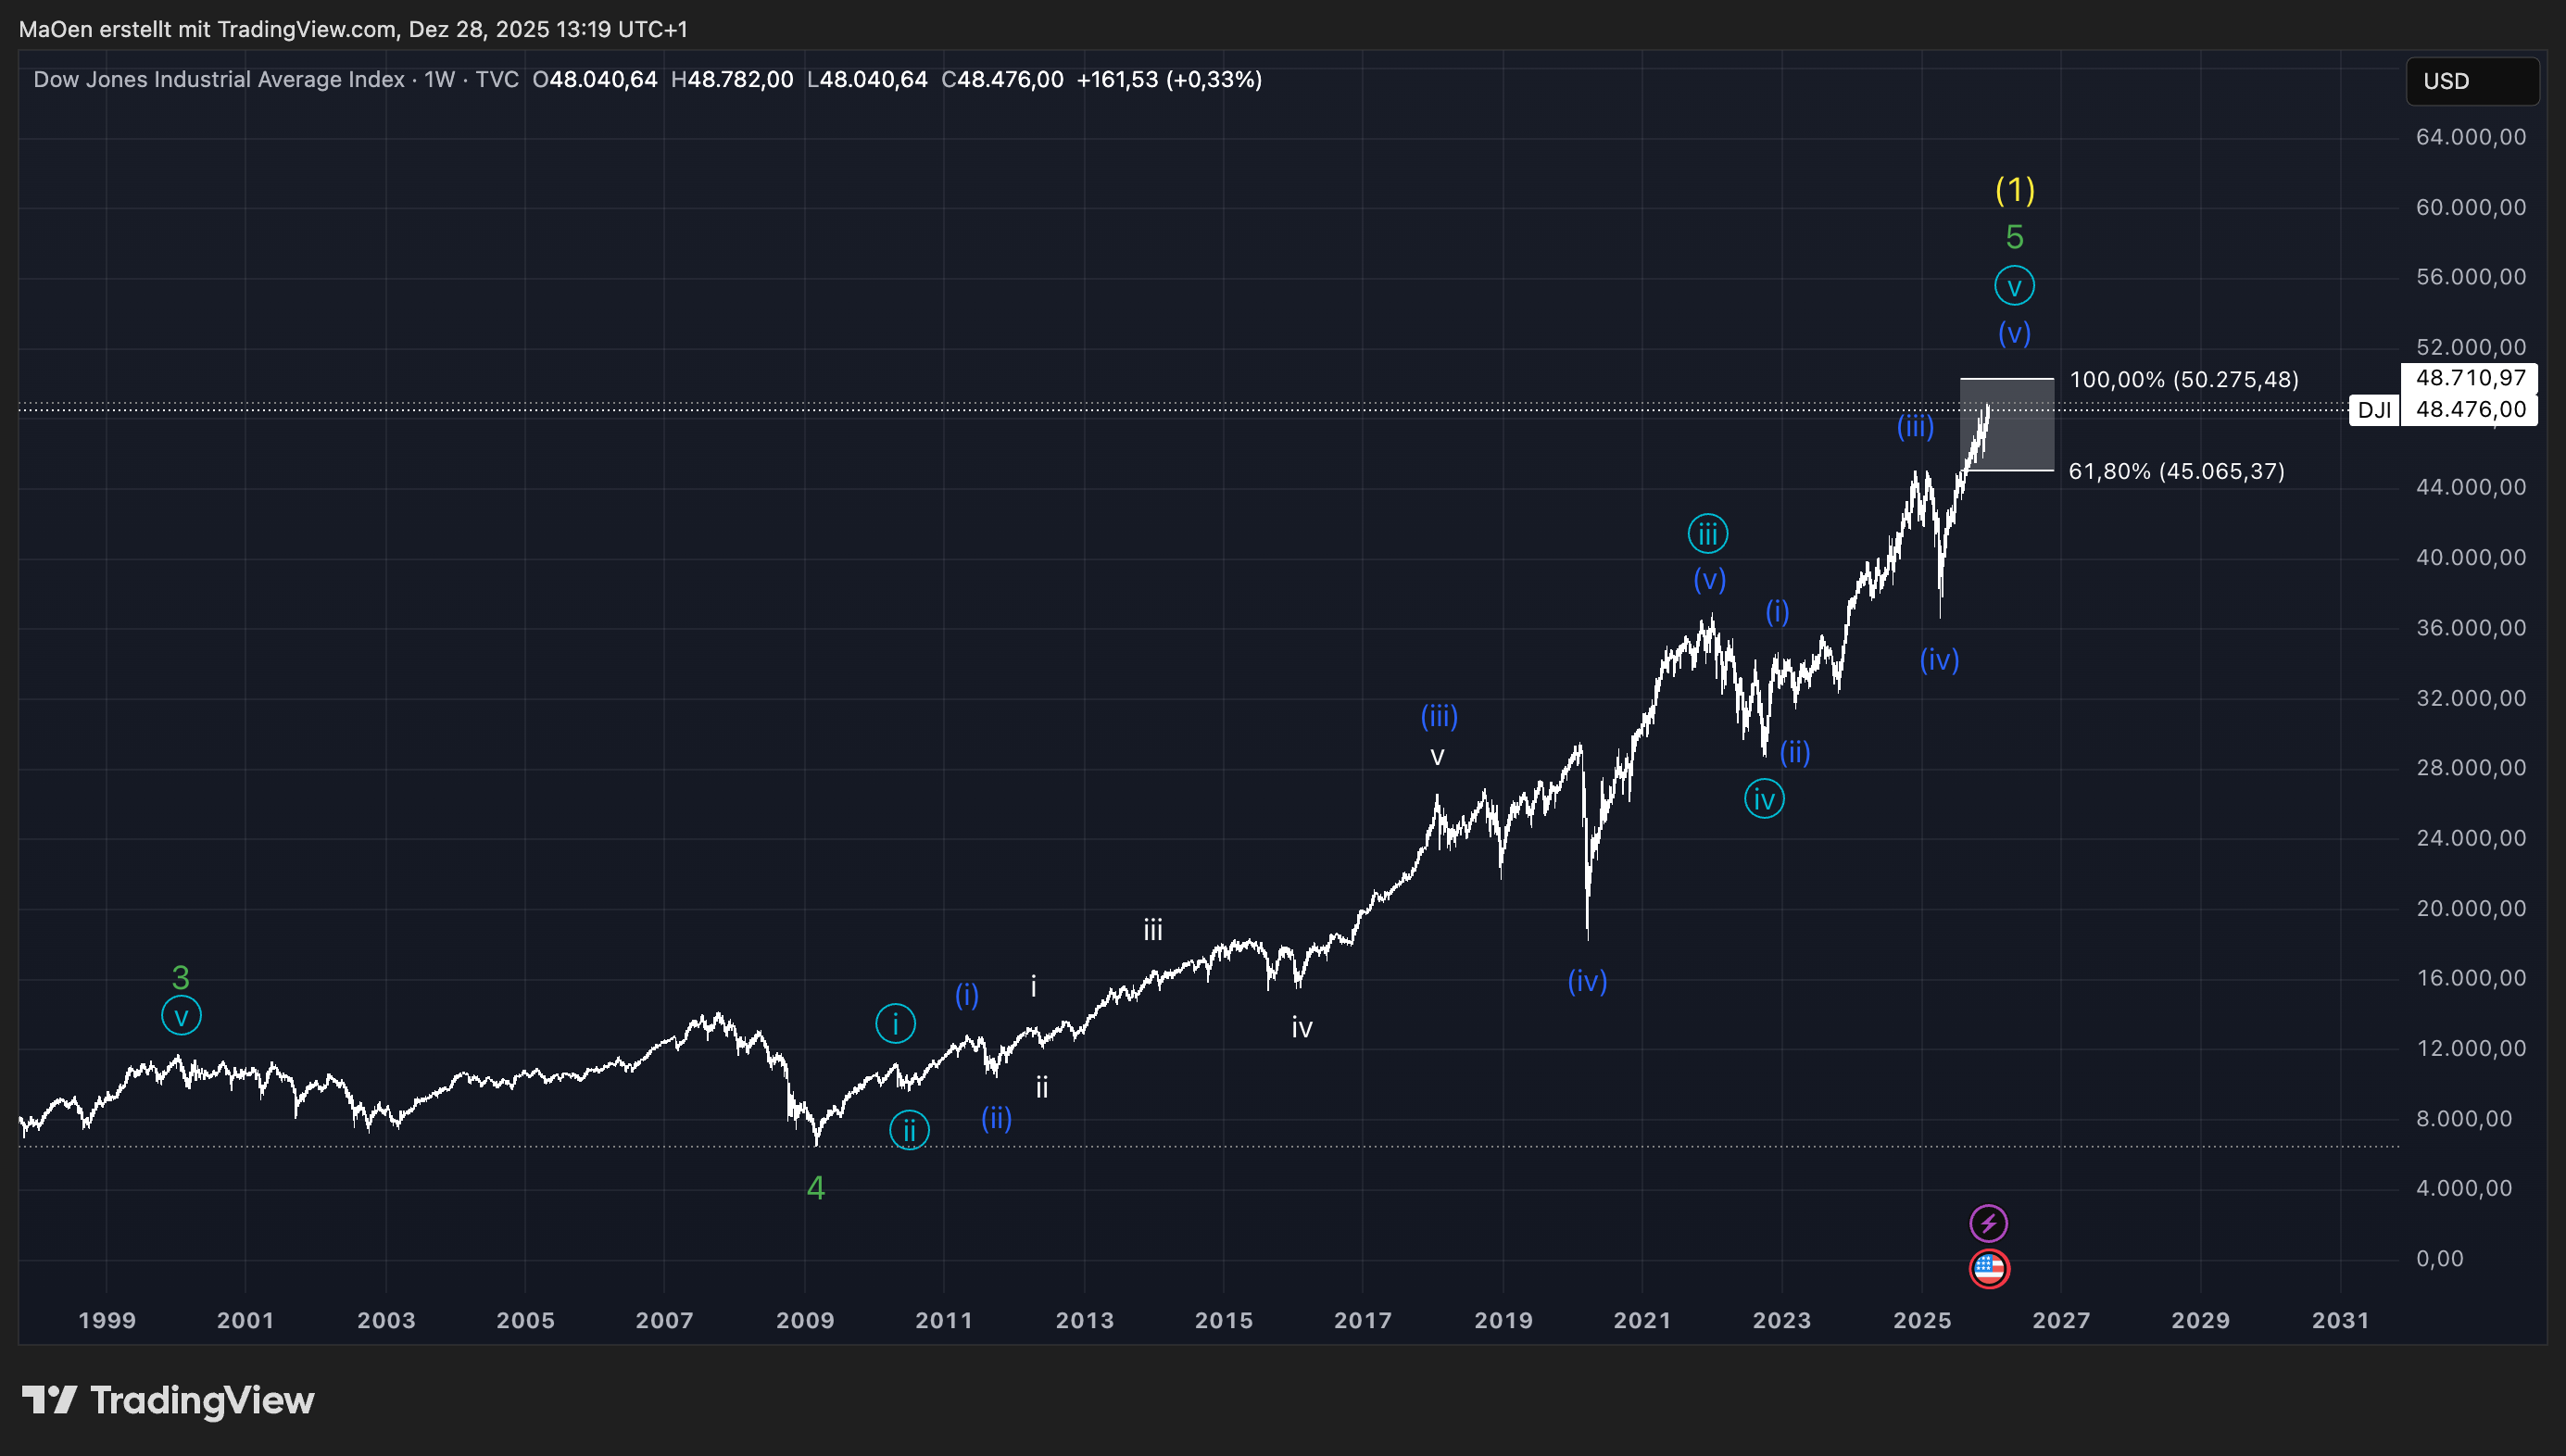
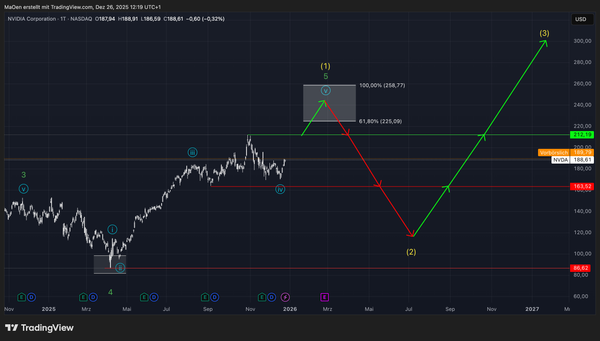
This chart shows our more short-term wave count for the Dow Jones Industrial Average. After completing the second long-term fractal with green wave 3 and green wave 4, the Dow Jones started its final long-term impulsive move into green wave 5, unfolding within the lower light blue cycle.
We have defined a Fibonacci price target zone for the Dow Jones, where we could potentially expect the index to form its final major top. From this area, we anticipate the completion of green wave 5 and the development of yellow wave 1 of the higher-degree long-term cycle.
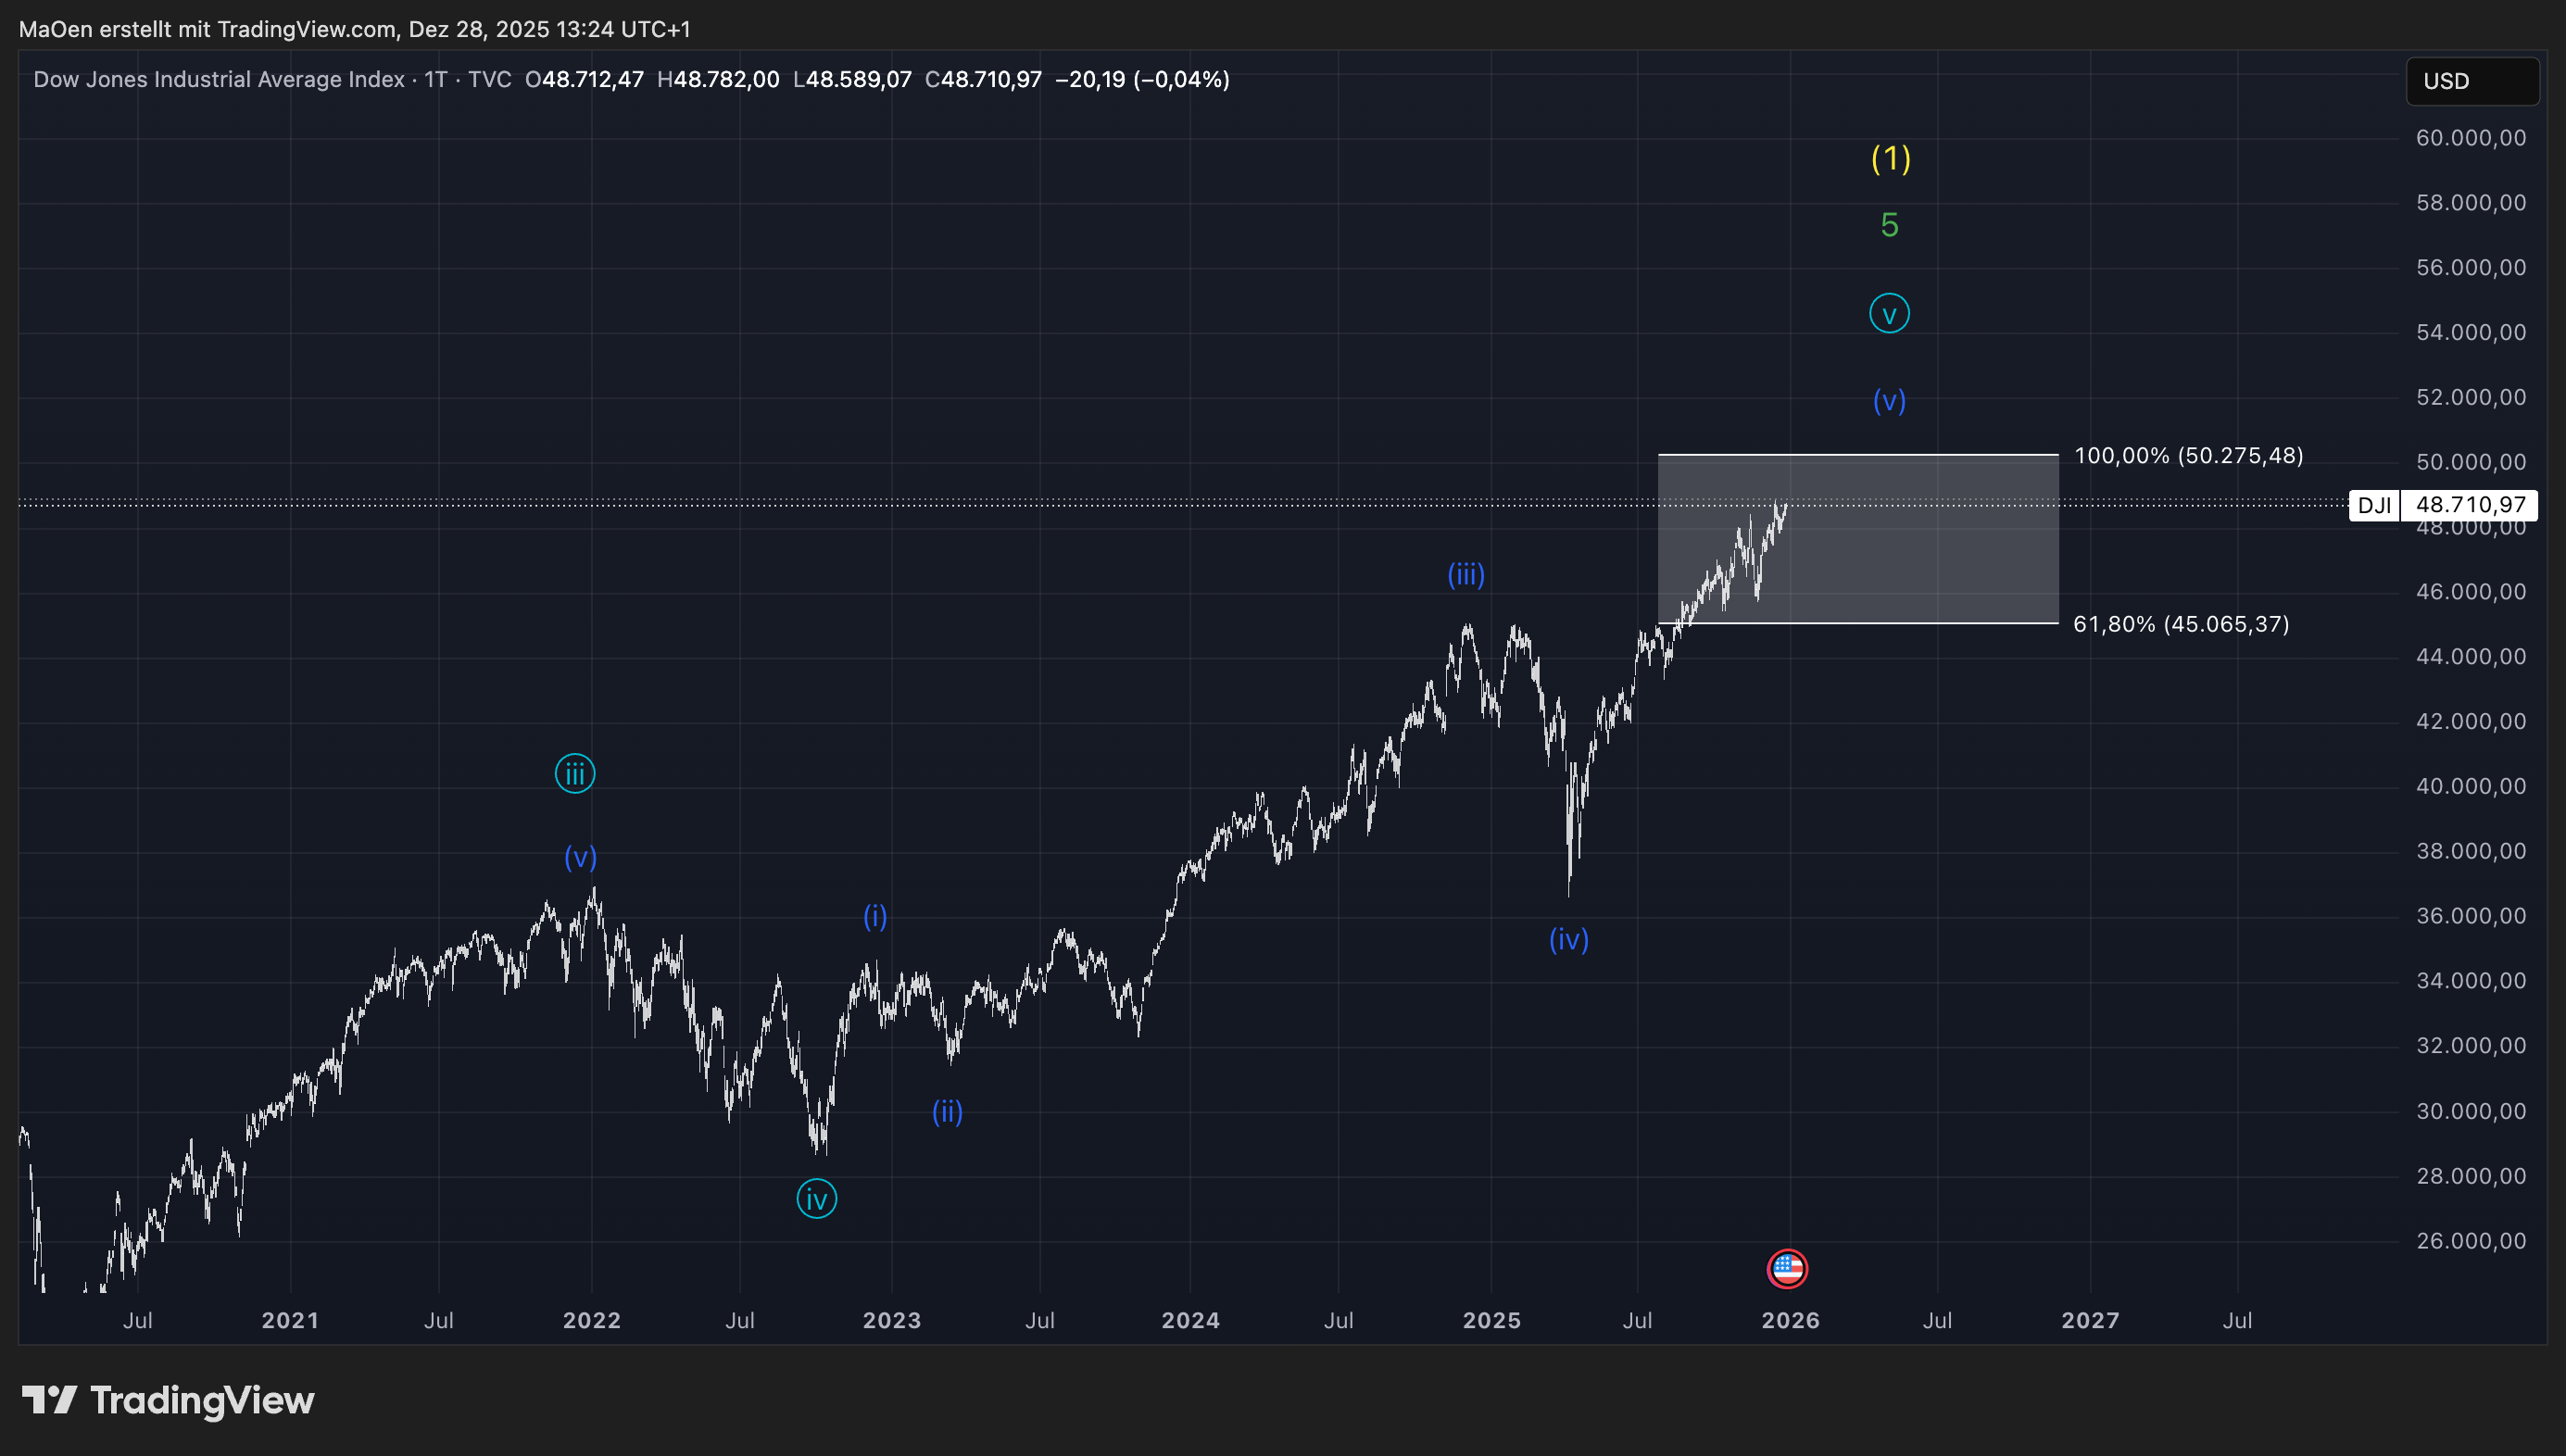
This Fibonacci price target zone starts at the 61.8% level at 45,065.37 points and extends up to the 100% level at 50,275.48 points. The Dow Jones is currently trading at 48,710.97 points and has already entered our projected price target zone. At this stage, the index is continuing to move higher toward the 100% Fibonacci level.
When reviewing historical price behavior from a long-term perspective, the Dow Jones has demonstrated strong upside potential and persistent bullish momentum. This opens the possibility of a price extension beyond our current target zone. Should such an extension occur, we would expand our analytical framework accordingly and activate additional Fibonacci levels to reassess the structure.
However, based on the current wave structure and our primary scenario, we remain committed to our existing expectations. We will provide timely updates should any relevant structural changes emerge in the Dow Jones.
In summary, our overall sentiment toward this index is bearish.
Kind regards,
Monalytics