Chainlink - long term EW-Analysis
This chart represents our primary long term expectations for Chainlink.
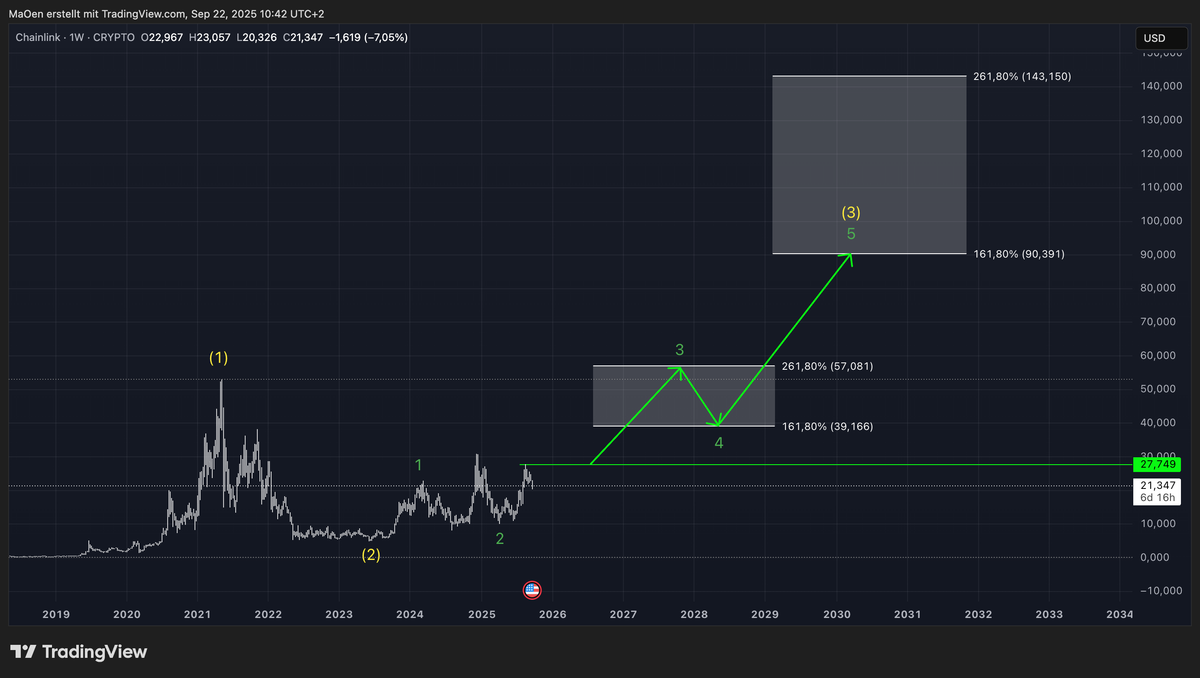
Chainlink has successfully established its first one-two structure in yellow, which extended into the end of 2024. From there, the coin developed another one-two setup, laying the foundation for an impulsive yellow Wave 3 to further extend the bullish cycle.
For Chainlink, we have defined two Fibonacci target zones:
- The first target zone projects potential price levels for the ongoing green Wave 3, ranging from the 161.8% extension at 39.16 USD up to the 261.8% extension at 57.00 USD.
- The second target zone reflects our expectations for the completion of the larger green cycle and the finalized yellow Wave 3, lying between the 161.8% extension at 90.39 USD and the 261.8% extension at 143.15 USD.
Trading Plan:
For our primary scenario to be confirmed, Chainlink needs to break above the neon-green resistance line at 27.74 USD, which would validate the unfolding of green Wave 3.
In our mid- to short-term analysis, we are focusing on potential buy opportunities for Chainlink within lower timeframes, to align with and follow the broader long-term Elliott Wave structure precisely.
This outlook reflects our primary expectation for Chainlink`s long-term performance. Always ensure that you review our long-term projections first before moving on to our mid- and short-term Elliott Wave analyses.