BTC at All-time high
Bitcoin is forming a new all-time high.
What does this now imply for the Bitcoin chart in terms of Elliott Wave analysis?
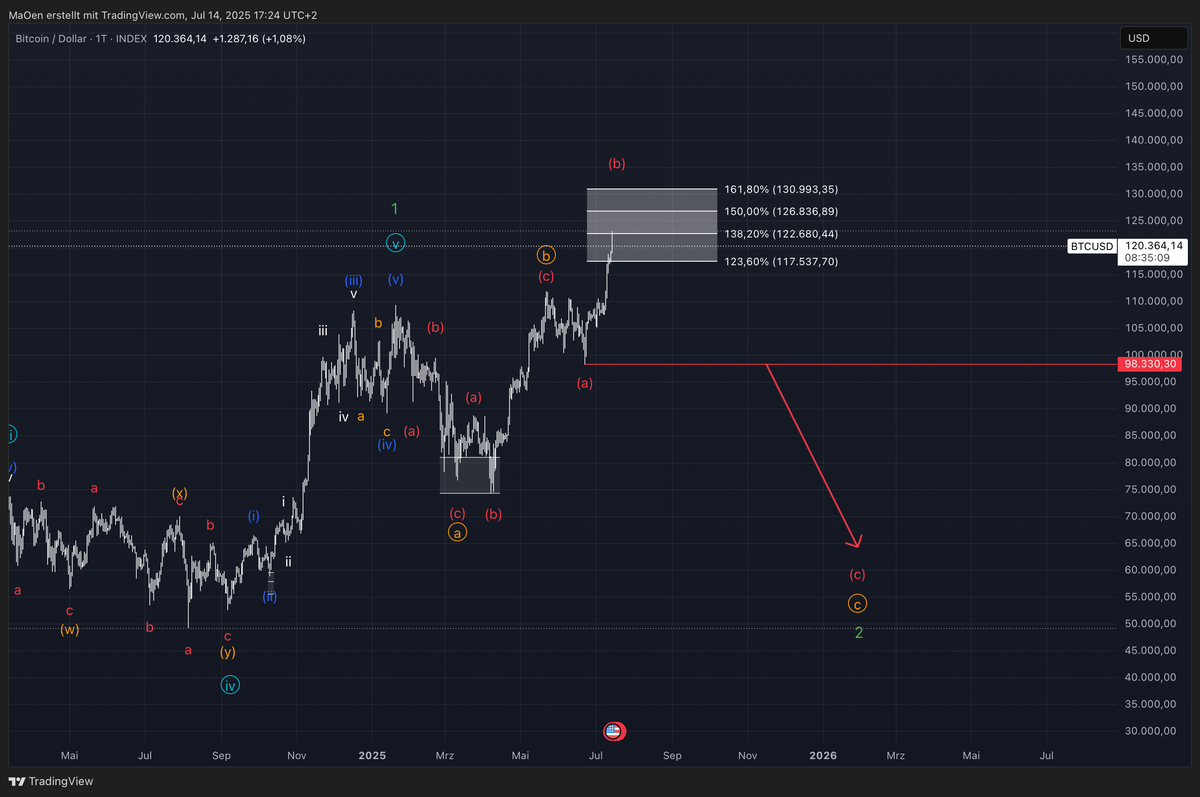
Bitcoin has moved up from its low, in December 2022, in a perfectly impulsive five-wave structure (in light blue) according to Elliott Wave, reaching the current levels. Through this five-wave move (in light blue), a wave 1 (in green) has been formed.
Following the completion of the higher-degree wave 1, Bitcoin has developed a structure that is to be interpreted as bearish, which has now culminated in a clearly overextended wave B (in orange), forming a new all-time high.
According to Elliott Wave theory, such an overextended wave B is considered a bearish formation and is expected to be followed by a wave C downwards, completing a corrective A-B-C structure into the green wave 2, which should result in a lower low compared to the preceding wave A.
Historically and currently, Bitcoin has been following the Elliott Wave count very precisely, which strengthens the validity of this analysis!
Stay updated about EW-analysis about BTC and more assets on Monalytics.com.