Blackrock (BLK)
BlackRock in front of a significant corrective phase!
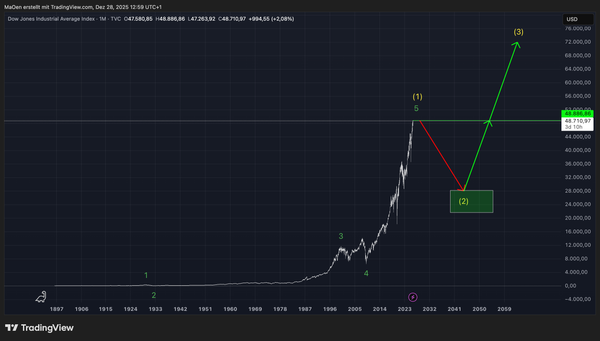
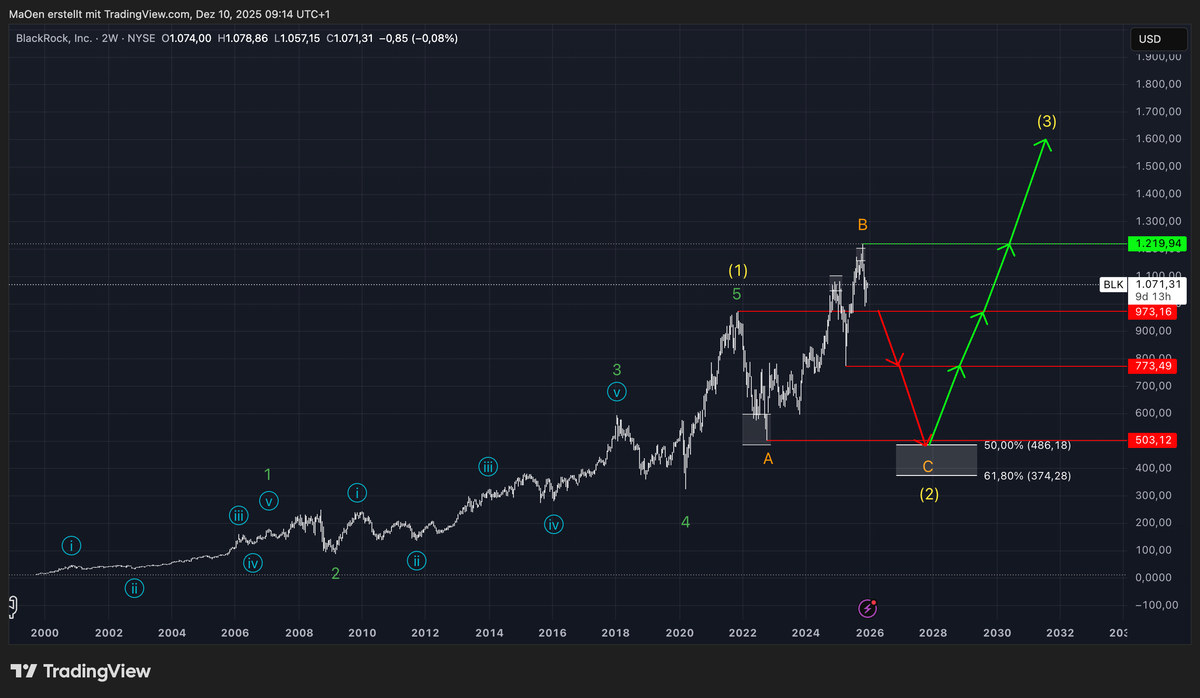
Since its IPO in 1999, the stock has delivered a substantial rally. In late 2006, BlackRock established its first full bullish impulse, completing green wave 1 and its corresponding corrective green wave 2. From that point onward, the stock advanced in a textbook impulsive structure: a powerful green wave 3, a moderating corrective green wave 4, and a final extension into green wave 5. This completed the entire green-degree cycle.
With the termination of green wave 5, the broader structure confirmed the formation of yellow wave 1 at the next higher degree, establishing the long-term bullish foundation for BlackRock.
Following the completion of yellow wave 1, the stock initiated its first meaningful sell-off, unfolding orange wave A and thereby beginning the larger corrective process for bearish yellow wave 2. For this developing wave 2, we have defined a Fibonacci retracement zone in which we expect BlackRock to re-establish bullish momentum and finalize the correction. This retracement area spans from the 50% level at 486.18 USD down to the 61.8% level at 374.28 USD.
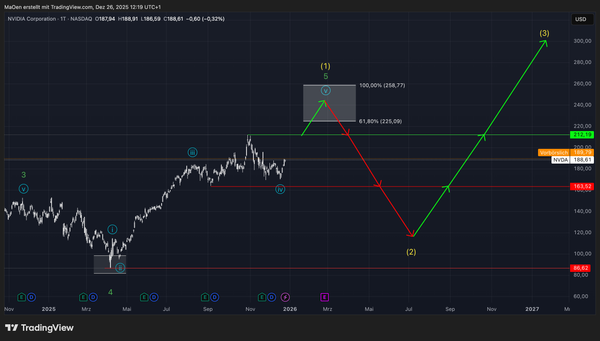
BlackRock has already completed its initial bearish sequence within orange wave A and has more recently finished orange wave B. Notably, wave B presented as an overshooting structure, culminating in a new all-time high. With that in place, we now expect the stock to be progressing into its final bearish sequence of yellow wave 2 and to have already initiated the first portion of orange wave C through a developing sell-off.
Our long-term count remains strict bullish. However, we first anticipate a substantial corrective decline to fully develop yellow wave 2 within our designated Fibonacci retracement zone. From that region, we expect BlackRock to regain strong upward momentum and begin establishing new impulsive advances into long-term yellow wave 3.
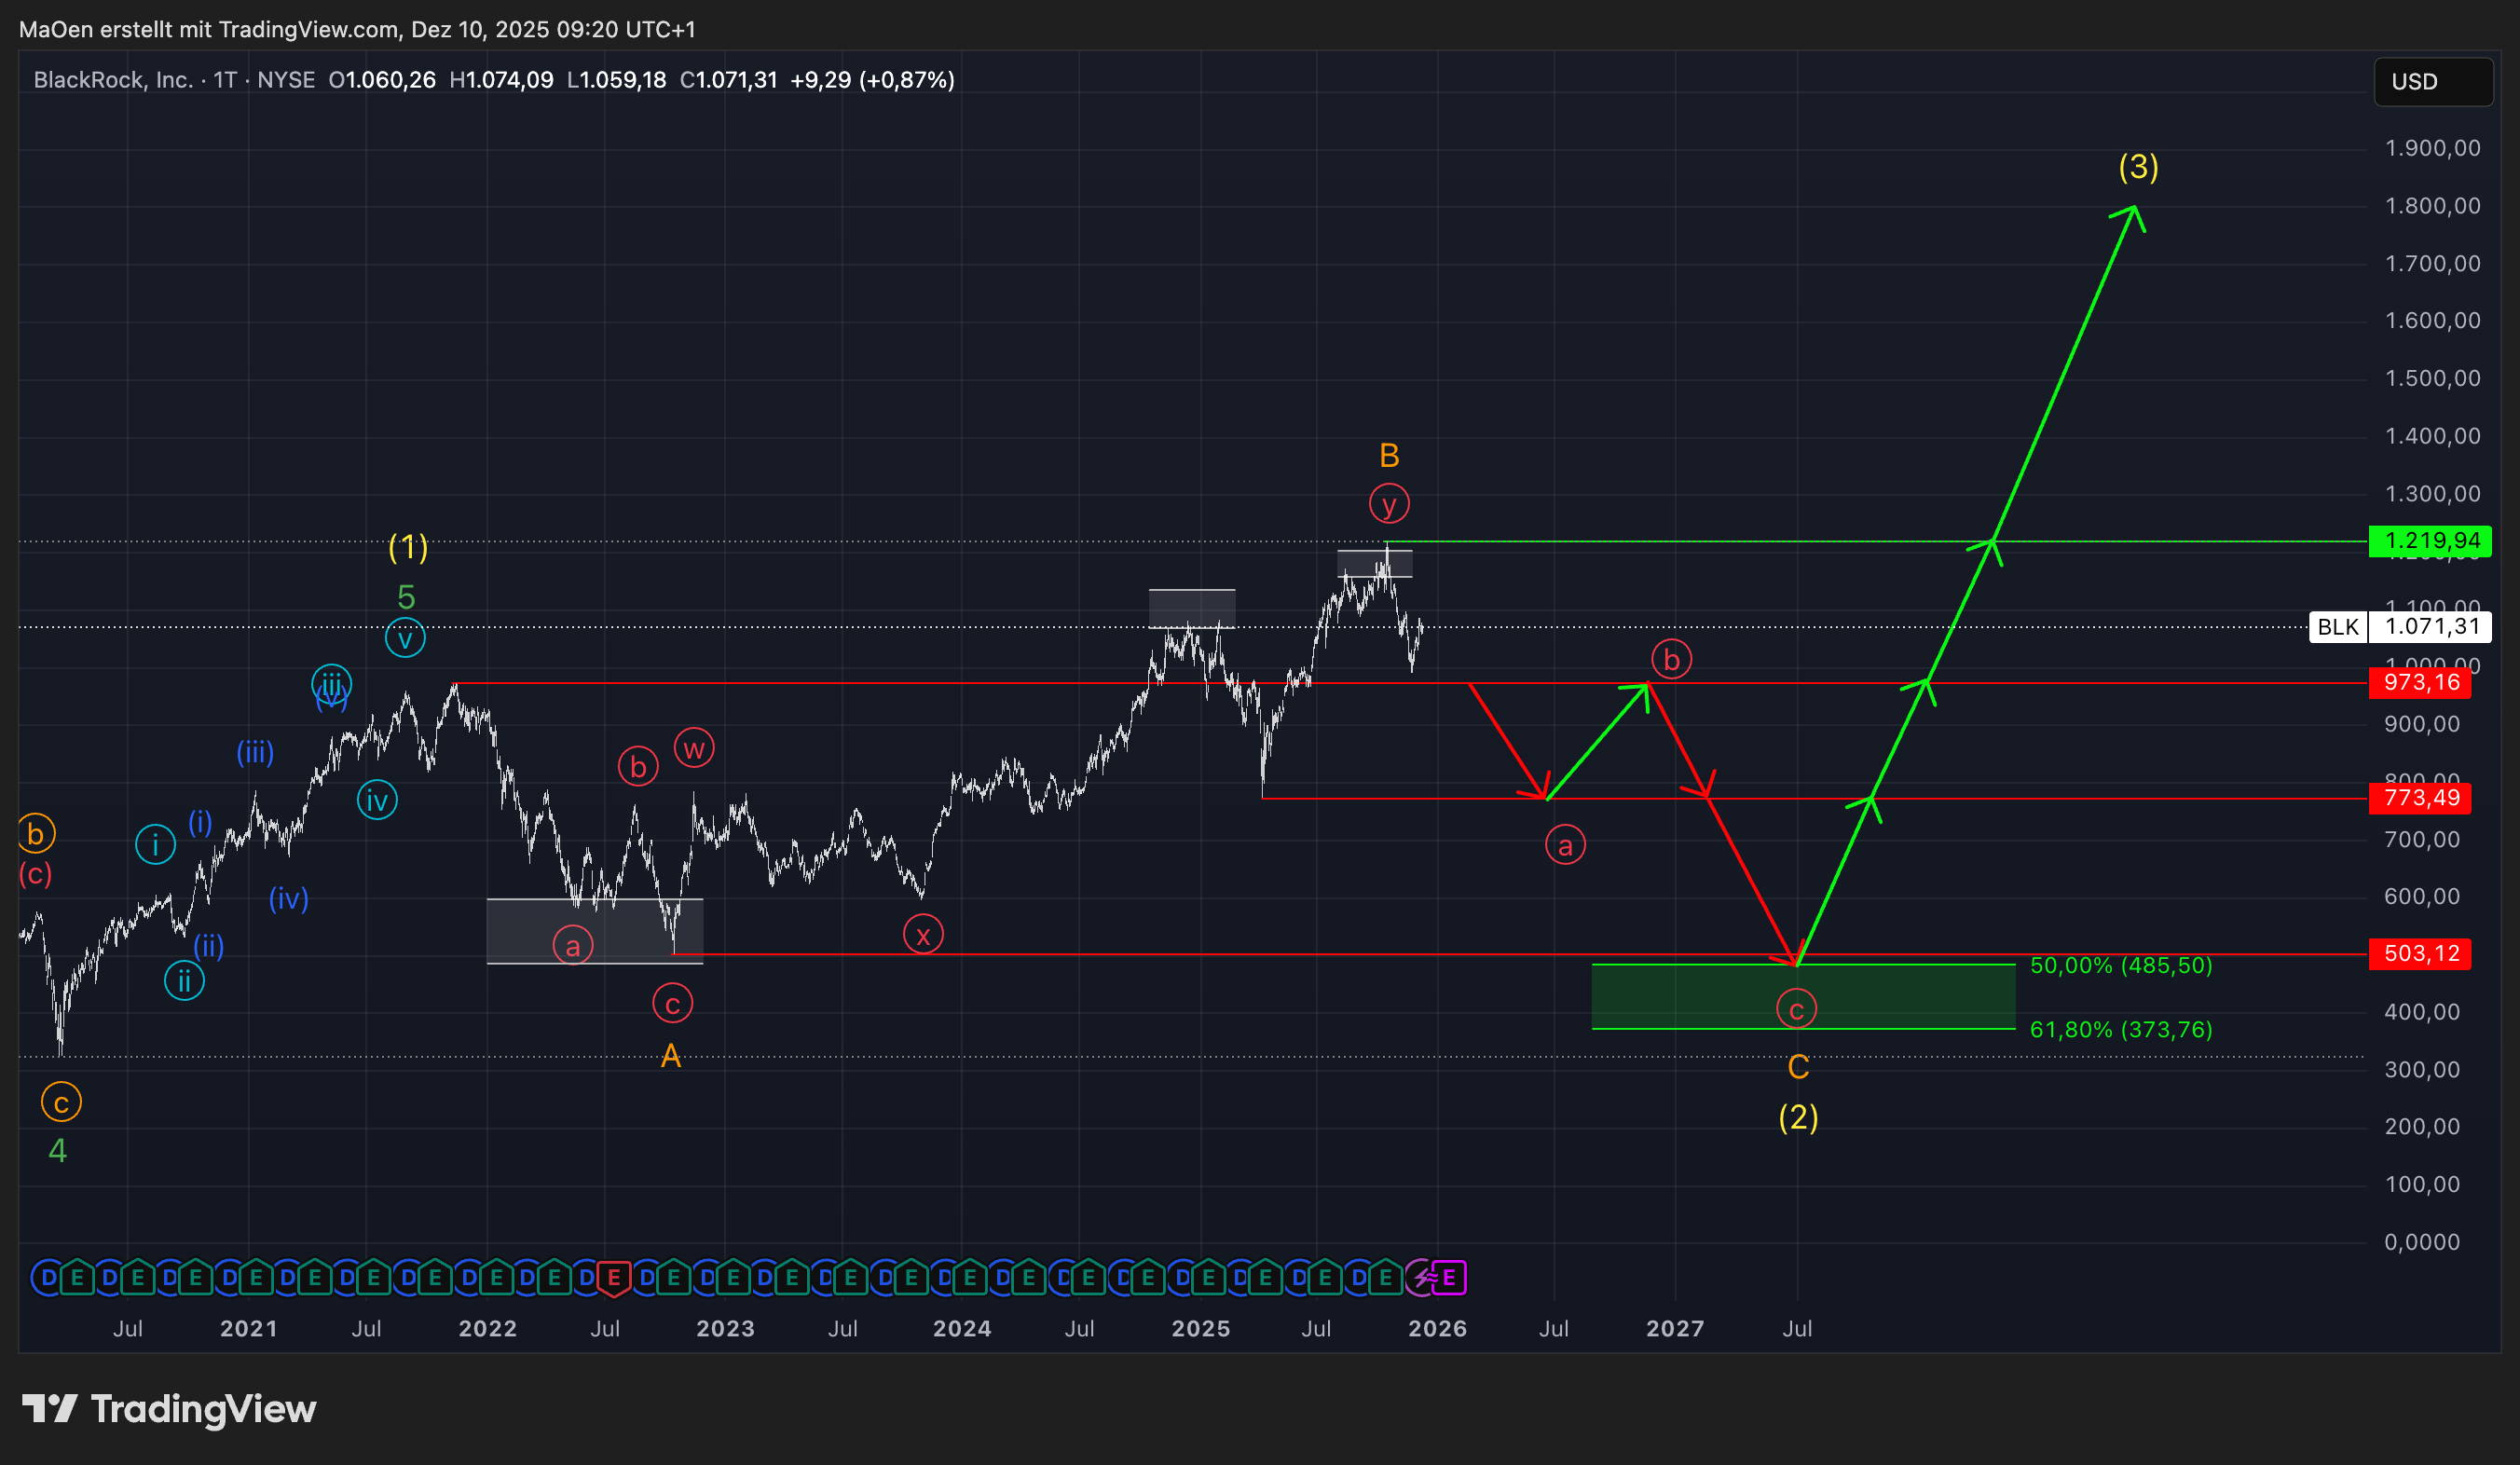
When examining our short-term count, it becomes evident that the near-term structure is fully aligned with our broader long-term expectations. We consider orange wave B to be already terminated. Accordingly, we now anticipate a standard three-legged decline (a–b–c, marked in red) to unfold as orange wave C, completing the corrective yellow wave 2.
Trading Plan:
Should BlackRock break below its key local support levels at 973.16 USD and 773.49 USD, the price action would validate our current outlook and significantly increase the probability of a continuation toward our Fibonacci retracement zone. This zone represents, in our view, an exceptional long-term accumulation opportunity at historically attractive price levels. If BlackRock reaches this area and initiates new impulsive advances as expected, we anticipate that prices within this Fibonacci zone will not be revisited for the foreseeable future.
In summary, our stance remains short-term bearish, but decisively long-term bullish.
If structural changes arise or BlackRock enters our target zone, we will provide an immediate update.
Kind regards,
Monalytics