Bitcoin – Elliott Wave Market Update & Trading Plan
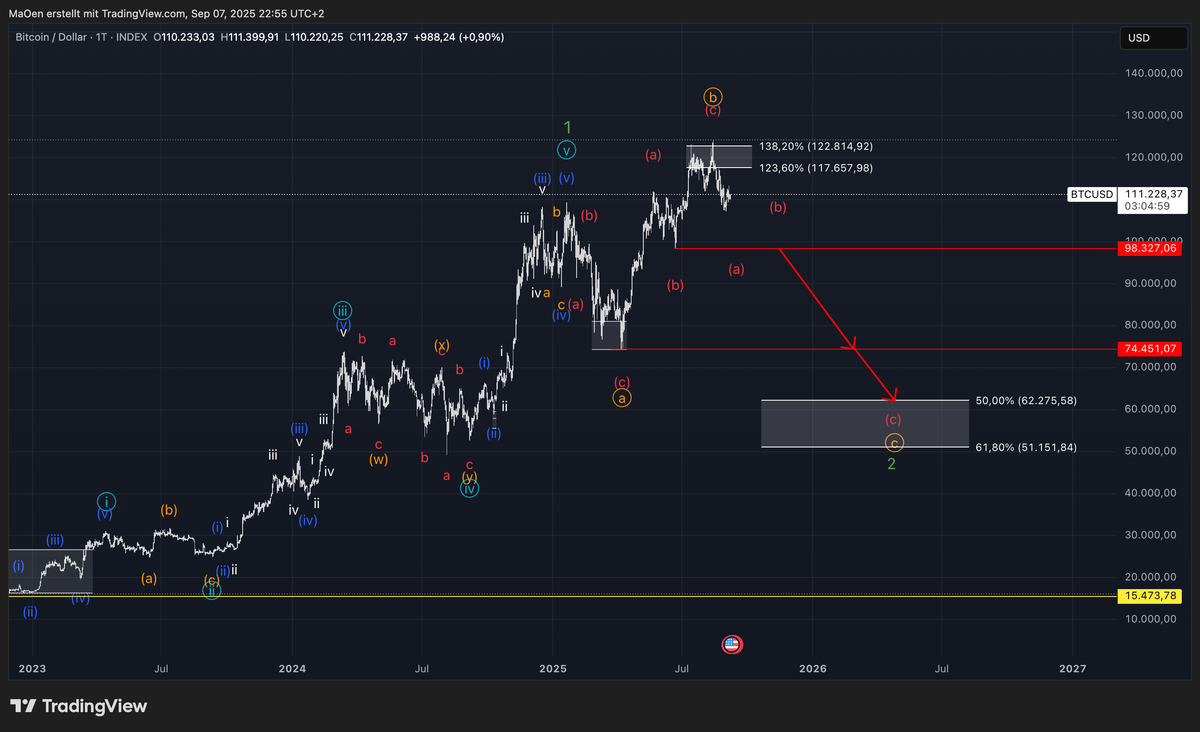
Bitcoin has successfully completed its green Wave 1 impulse and is now in the corrective phase of Wave 2. This correction has already unfolded into a completed Wave A, which precisely reached our previously defined target zone. After this, the price reversed and moved upward into Wave B, pushing back toward the previous highs.
Wave B turned out to be an overshooting B-wave, extending higher than typical and approaching the prior Wave 1 peak. However, it also aligned with a previously identified resistance zone, based on Fibonacci extension levels. Once this target was met, the market reversed again — suggesting that Wave B is now complete.
At this stage, Bitcoin is likely in the final leg of the correction — the unfolding of Wave C. This wave is expected to develop as a five-wave decline, completing the overall A-B-C zigzag pattern that forms Wave 2.
The key target zone for the end of Wave C lies between the:
- 50% Fibonacci retracement of Wave 1: around 62,000 USD
- 61.8% Fibonacci retracement of Wave 1: around 51,000 USD
This area remains the primary support zone where the market may complete its correction and resume the broader uptrend with Wave 3.
Trading Plan
The trading plan based on this analysis is straightforward:
Wait to see whether Bitcoin reaches the 51k–62k target zone before considering any new long positions.
If price enters this support zone and shows signs of reversal — such as a completed Wave C structure or bullish confirmation signals — it may offer a strong opportunity to position for Wave 3, which is typically the most dynamic and extended wave in the Elliott Wave sequence.
Patience is key: We are not looking to front-run the market, but rather to respond if and when Bitcoin confirms that this corrective phase has completed.