ARM holdings (ARM)
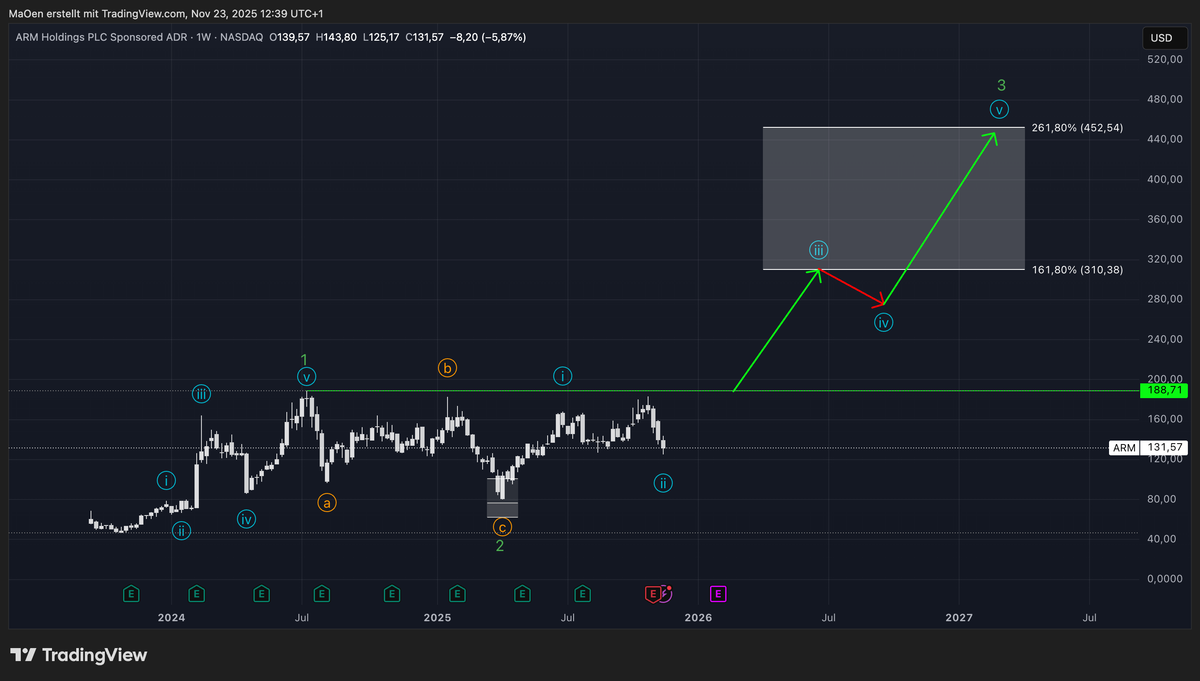
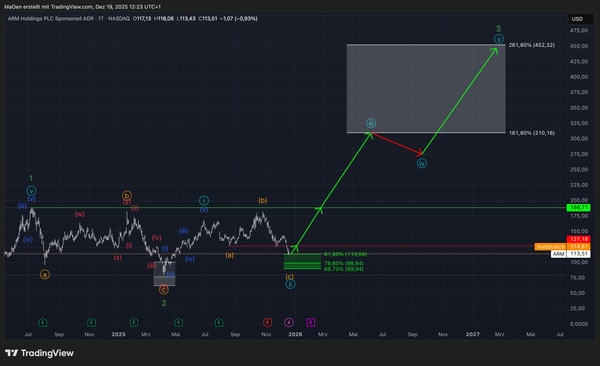
Since its IPO on 14 September 2023, ARM Holdings has shown an exceptionally strong start. The stock established a well-defined initial sequence with a green (Primary) Wave 1, laying a solid foundation for the broader bullish structure.
Following the completion of this green Wave 1, ARM Holdings entered a corrective phase that unfolded as a green Wave 2, which has now also been successfully completed. With this correction behind us, the stock launched into the early stages of its long-term green Wave 3, beginning with a light-blue (Intermediate) Wave 1.
Currently, ARM Holdings is retracing this initial impulsive advance within a light-blue Wave 2. Once this short-term correction concludes, the stock is expected to resume its upward trajectory, targeting its all-time high at 188.71 USD(highlighted in neon green) and then extending significantly beyond, into our projected Fibonacci expansion zone.
This Fibonacci target zone—representing typical extension levels for a bullish third wave—ranges from the 161.8% level at 310.38 USD to the 261.8% level at 452.54 USD. We anticipate that the developing light-blue Waves 3, 4, and 5 will collectively build out the larger green Wave 3, carrying the price into this zone. However, it is important to emphasize that these levels mark common targets for a Wave 3, and strongly impulsive third waves can overshoot them by a wide margin.
Our long-term outlook aligns seamlessly with our short-term wave counts, and the current structure continues to support a high-conviction bullish scenario for ARM Holdings.
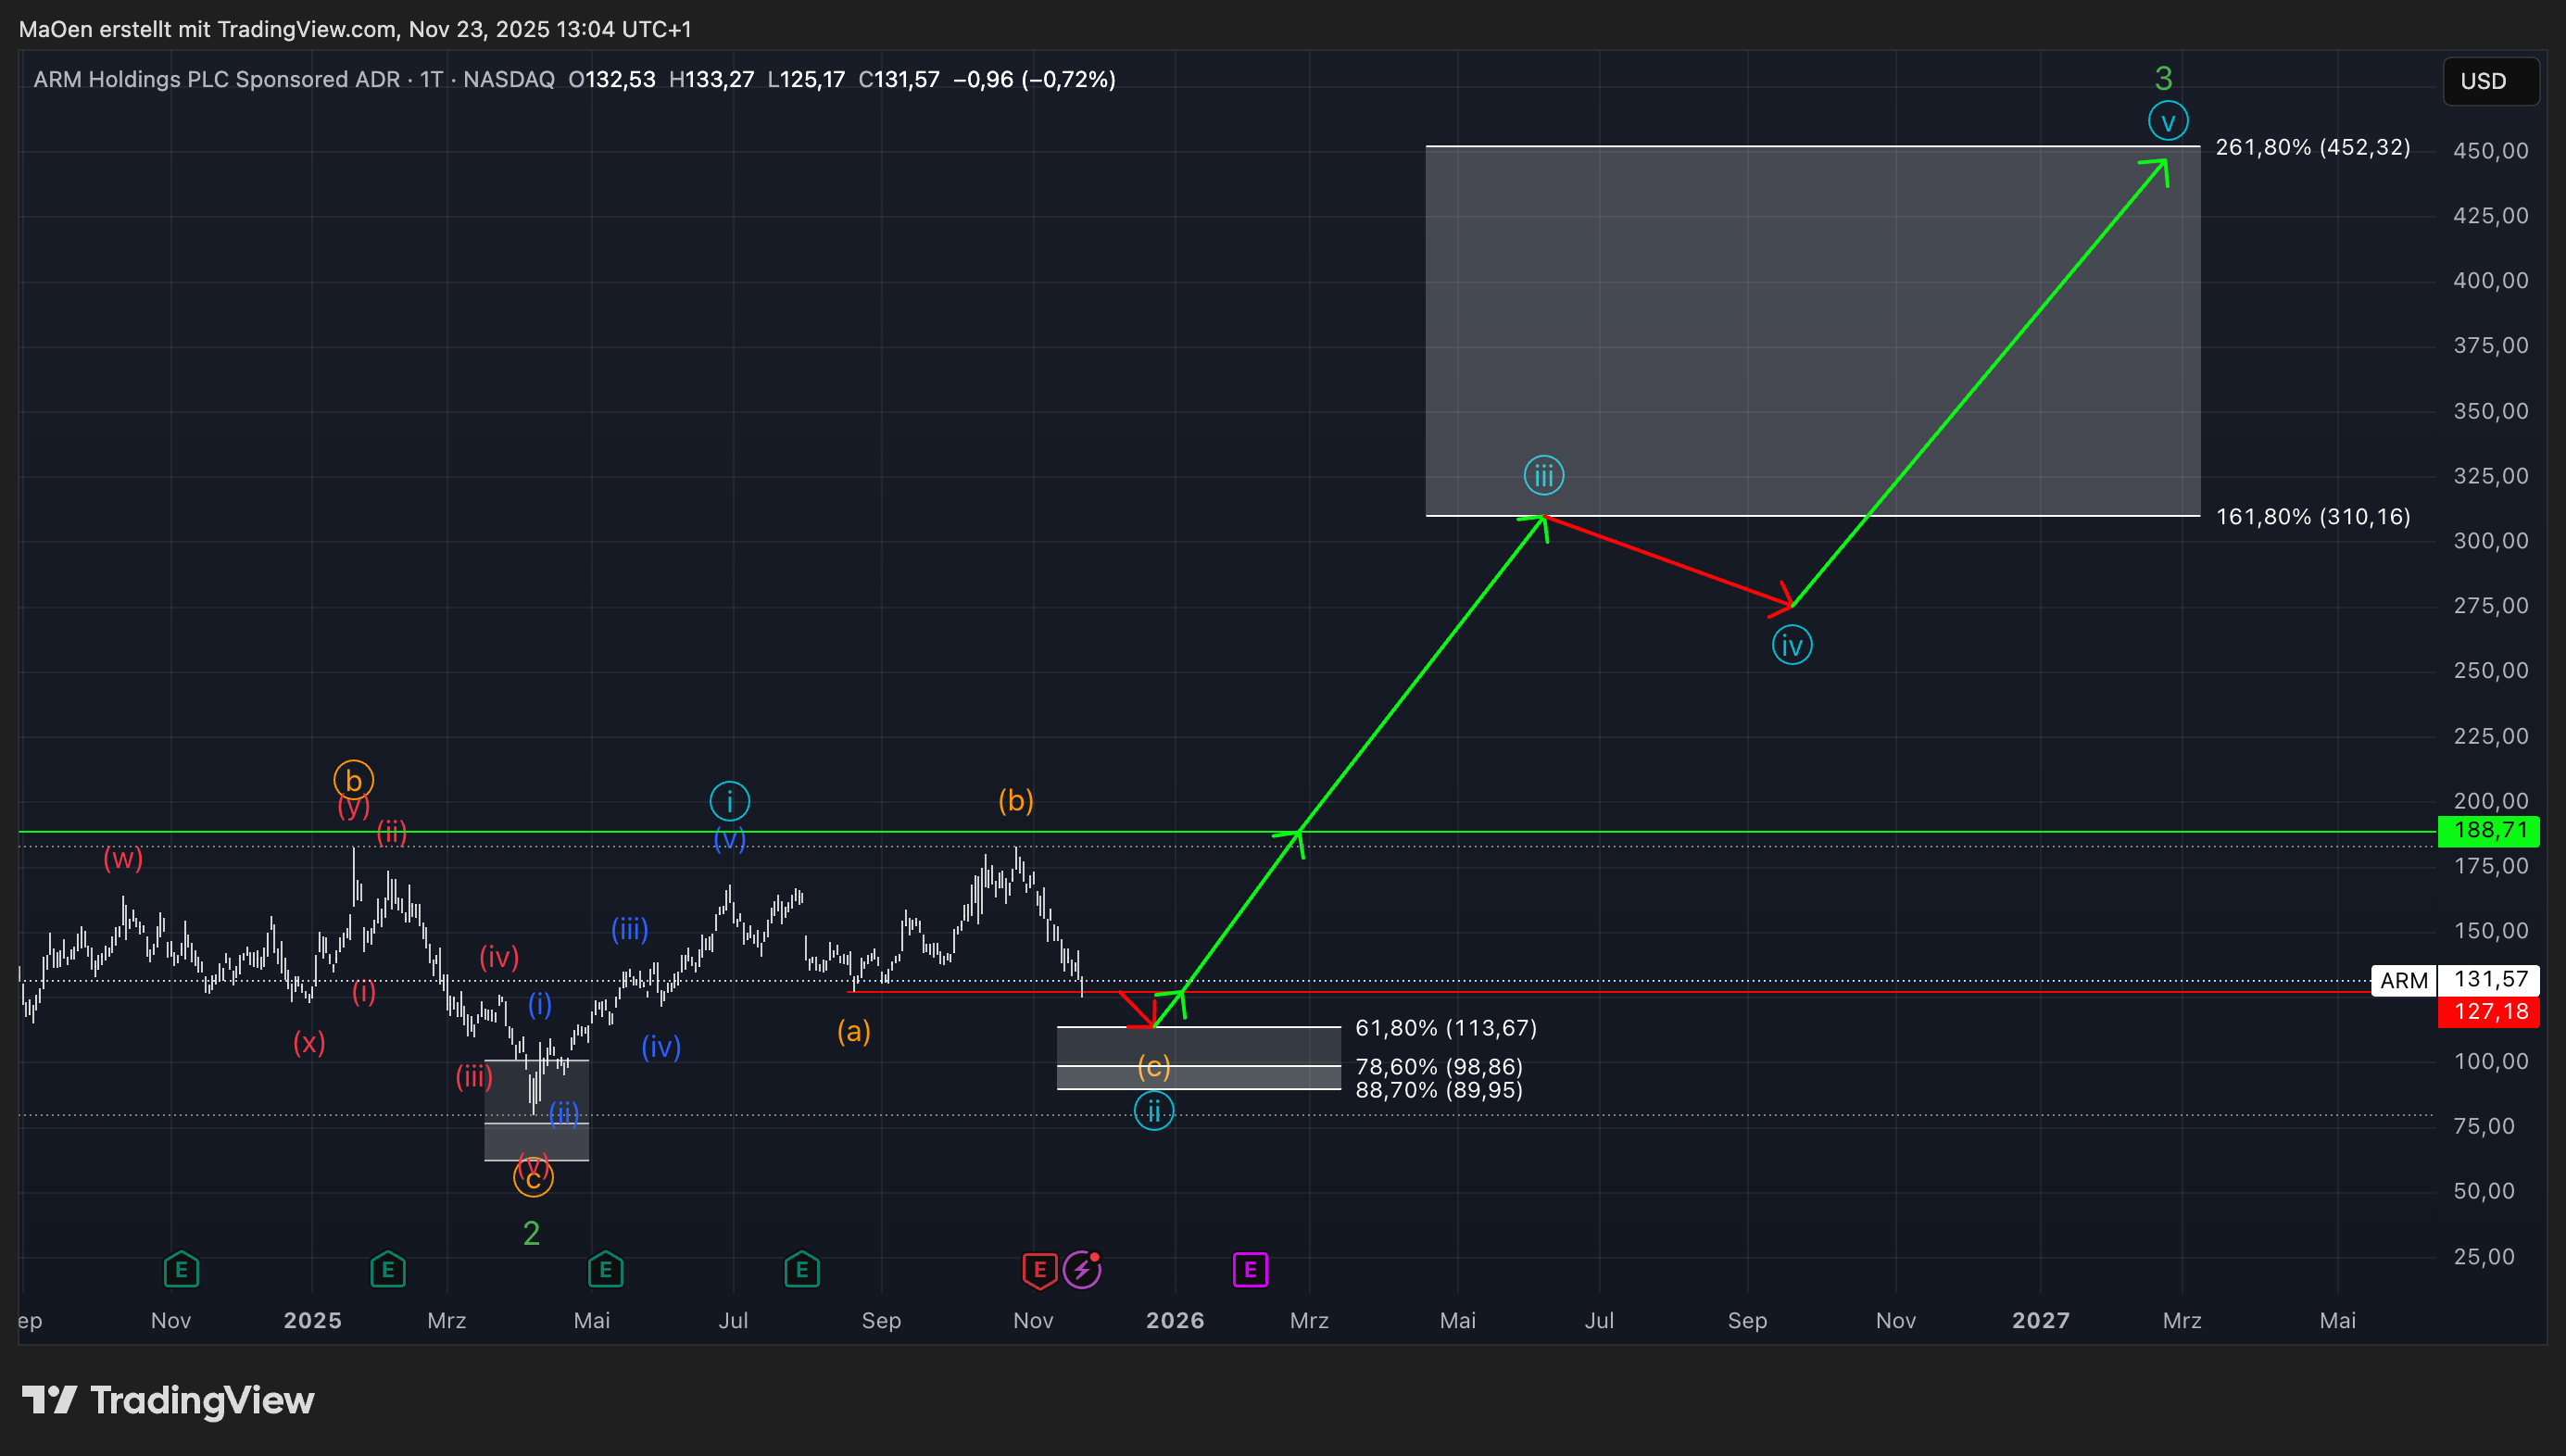
Our short-term count indicates that ARM Holdings has successfully completed its first impulsive advance as light-blue Wave 1 and is currently undergoing a corrective decline within bearish light-blue Wave 2. After forming a standard orange Wave A, the market produced an overshooting orange Wave B. With Wave B completed, ARM Holdings has now entered the final stage of its correction, unfolding orange Wave C, which will complete the broader light-blue Wave 2.
We have defined a Fibonacci retracement zone in which we expect ARM Holdings to locate its bottom for light-blue Wave 2 and shift from bearish momentum back into bullish continuation. This retracement zone spans from the 61.8% level at 113.67 USD down to the 88.7% level at 89.95 USD.
Trading Plan:
We anticipate ARM Holdings to break its local support at the level of orange Wave A (127.18 USD) and decline into our Fibonacci retracement zone. Such a move would represent an ideal buying opportunity at significantly discounted prices. From this zone, we expect light-blue Wave 2 to complete, allowing the stock to resume impulsive upside movement, break its current all-time high, and advance toward the Fibonacci projection levels outlined in our long-term analysis.
Overall, we remain bullish on this stock and intend to capitalize on this potential accumulation opportunity.
Should ARM Holdings reach our Fibonacci retracement zone—or if any structural changes arise—we will provide an immediate update and present a refreshed outlook for this market.
Kind regards,
Monalytics