Amazon long-term EW-Analysis
This chart represents our primary long term expectations for Amazon.
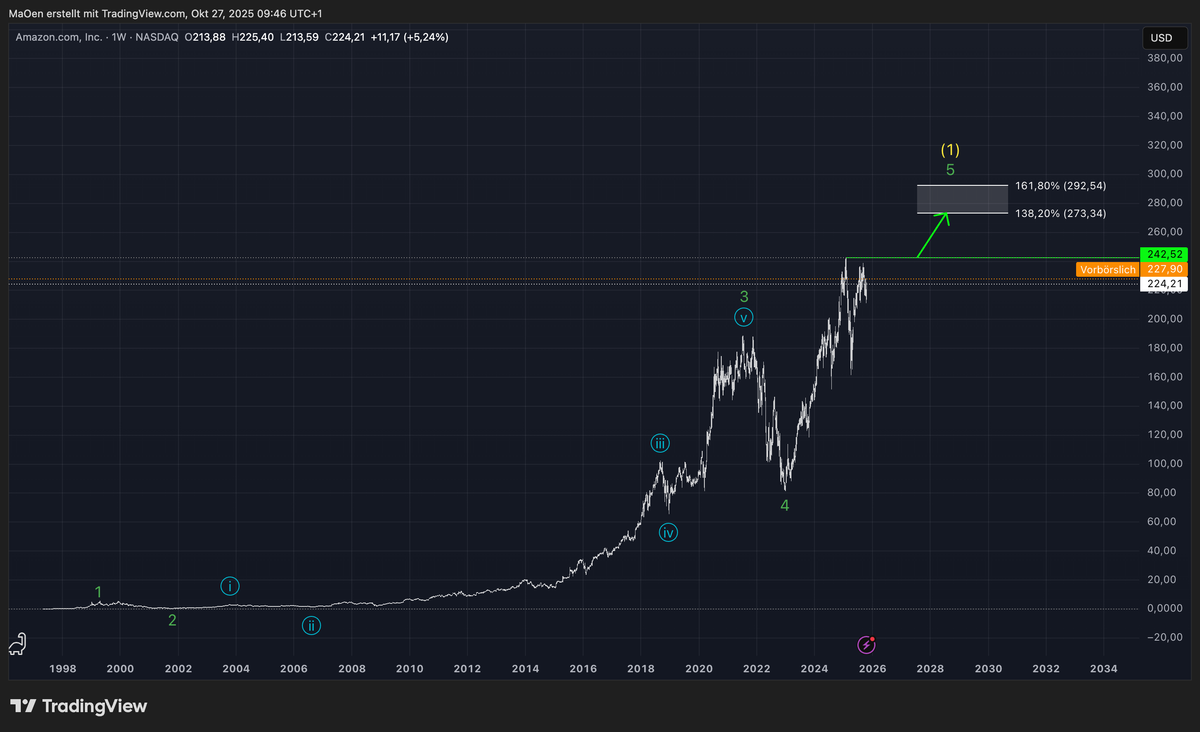
Since its launch in May 1997, Amazon has completed an exemplary long-term bullish Elliott Wave cycle (shown in green), which now appears to be approaching its terminal phase. The structure consists of a fully developed five-wave impulse — beginning with an initial Wave 1 advance, followed by a Wave 2 correction, and a strong, extended Wave 3. After the completion of Wave 4, Amazon now seems to be in the final stages of Wave 5 in green.
This five-wave sequence represents Wave 1 of a larger degree (in yellow), forming the foundation of a higher-order impulsive cycle. Once this long-term bullish advance concludes, we anticipate a corrective retracement in Wave 2(yellow) before the next major upward phase resumes.
We have identified a price target zone where Amazon could potentially complete its long-term bullish cycle. This zone lies between the 138.2% and 161.8% Fibonacci extension levels.
Trading Plan:
We expect Amazon to break above its current all-time high at $242.52, extending toward the Fibonacci expansion zone between $273.34 and $292.54. Within this range, we anticipate a potential completion of Wave 5 in green, marking the termination of the current bullish cycle and the onset of a higher-degree corrective phase (Wave 2 in yellow).
Once a confirmed top is established, we will outline the expected retracement targets for this forthcoming corrective phase.
This outlook reflects our primary expectation for Amazon`s long-term performance. Always ensure that you review our long-term projections first before moving on to our mid- and short-term Elliott Wave analyses.