Advanced Micro Devices (AMD) EW-Analysis
AMD is in front of one of its biggest opportunities.
Since its IPO in 1972, AMD has shown a relatively passive long-term history. After forming an initial long-term impulsive fractal within yellow wave 1, the market transitioned into a prolonged corrective phase, completing yellow wave 2. This correction lasted from 1984 to 2016—more than 32 years—establishing a strong long-term base for future bullish development.
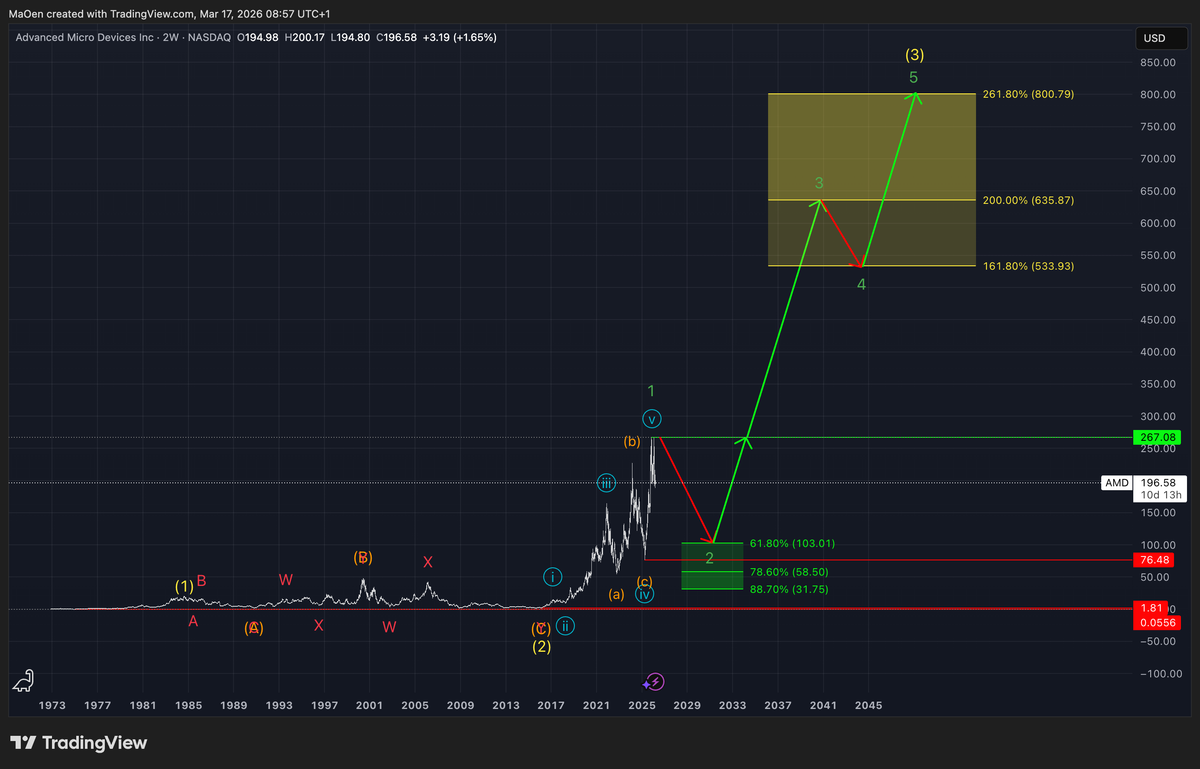
In January 2016, AMD regained sustainable bullish momentum and initiated a new impulsive structure within the light blue cycle. This light blue cycle has now completed and culminated at the current all-time high of $267.08, forming green wave 1 of a higher-degree structure.
Our expectation is that AMD will now enter a short- to mid-term corrective phase within green wave 2. Once green wave 2 is completed, we anticipate a strong expansion in bullish momentum, driving the price toward new all-time highs and into our projected Fibonacci target zone.
Within this target zone, we expect the broader green cycle to unfold further. After the completion of green wave 3, a corrective green wave 4 should follow, leading into a final impulsive leg in green wave 5. This would complete the green cycle and contribute to the development of yellow wave 3 on a higher degree.
The projected Fibonacci price target zone serves as a guideline for where this long-term green cycle—and potentially yellow wave 3—may complete. The key levels are:
- 161.8% at $533.93
- 200% at $635.87
- 261.8% at $800.79
At present, the market has only completed green wave 1 and appears to be in the early stages of a short- to mid-term corrective phase within green wave 2.
If you want, I can also tighten it further into a more “institutional / analyst report” tone or keep it more trader-style.
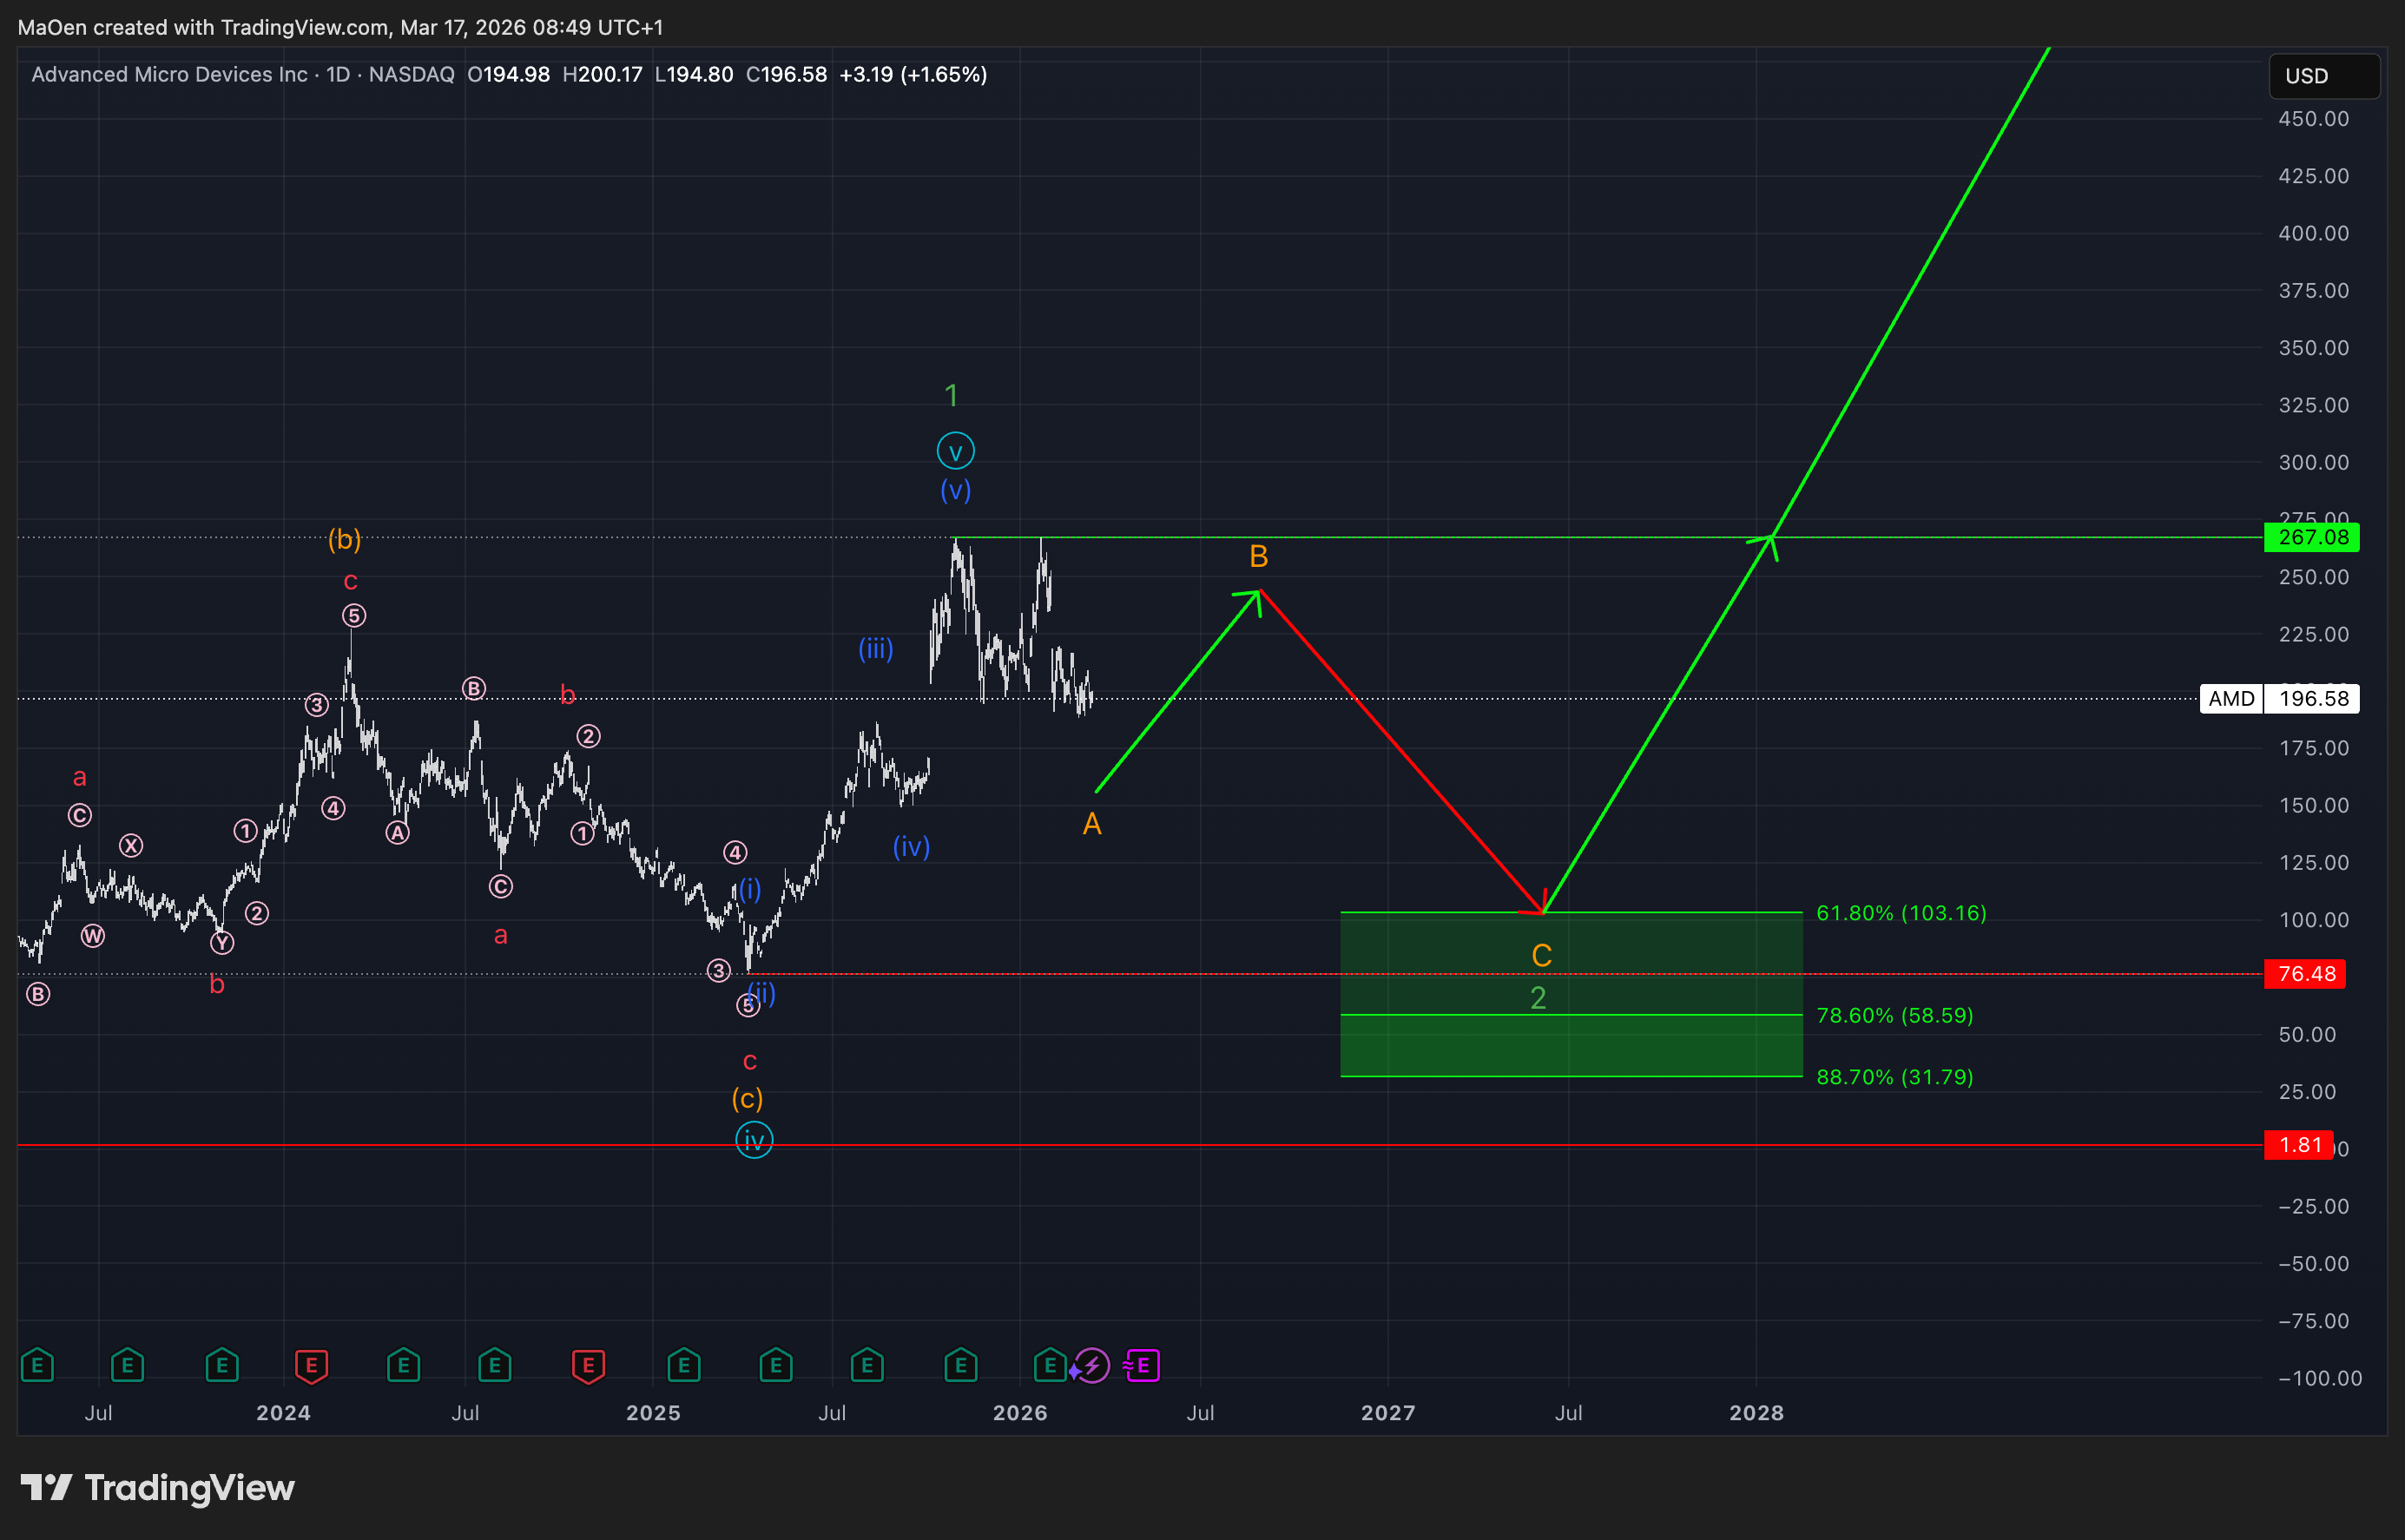
Since AMD has reached its current all-time high and completed green wave 1, we have defined a Fibonacci retracement zone in which we expect the ongoing correction within green wave 2 to come to an end.
This zone is defined as follows:
- 61.8% at $103.16
- 78.6% at $58.59
- 88.7% at $31.79
From our perspective, this zone represents prime buying and accumulation opportunities for the stock. In the context of our long-term outlook, these levels reflect extremely attractive valuations.
We expect AMD to complete its corrective phase and finalize green wave 2 within this zone, followed by a strong recovery in bullish momentum in line with our long-term expectations.
If any structural changes occur, or if AMD reaches and activates our Fibonacci retracement zone, we will provide updates immediately.
Kind regards,
Monalytics
DISCLAIMER: The content on this website, including charts, analyses, and recommendations, is for informational purposes only and does not constitute financial, investment, or professional advice. Trading and investing involve risk. You should consult a qualified financial advisor before making any investment decisions.